

Question: RATIO ANALYSIS Data for Barry Computer Co. and its industry averages follow. Barry Computer Company: Balance Sheet as of December 31, 2016 (In Thousands) Cash
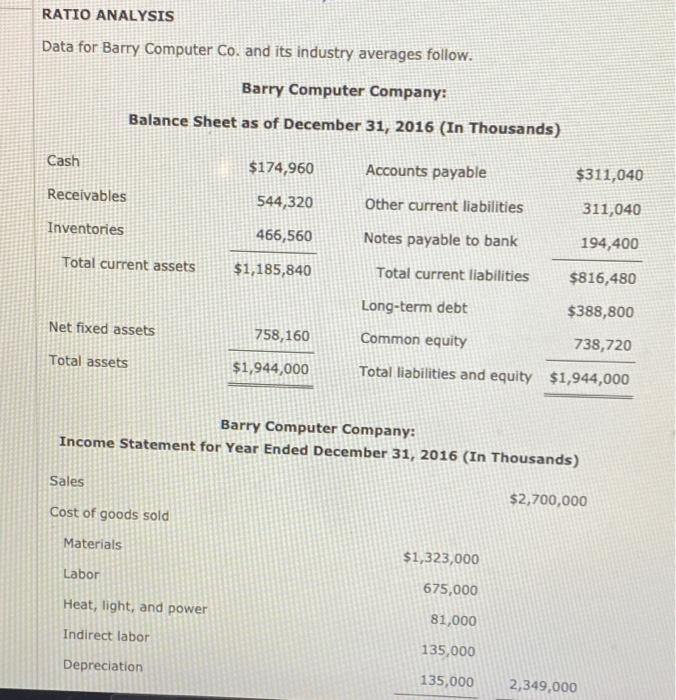
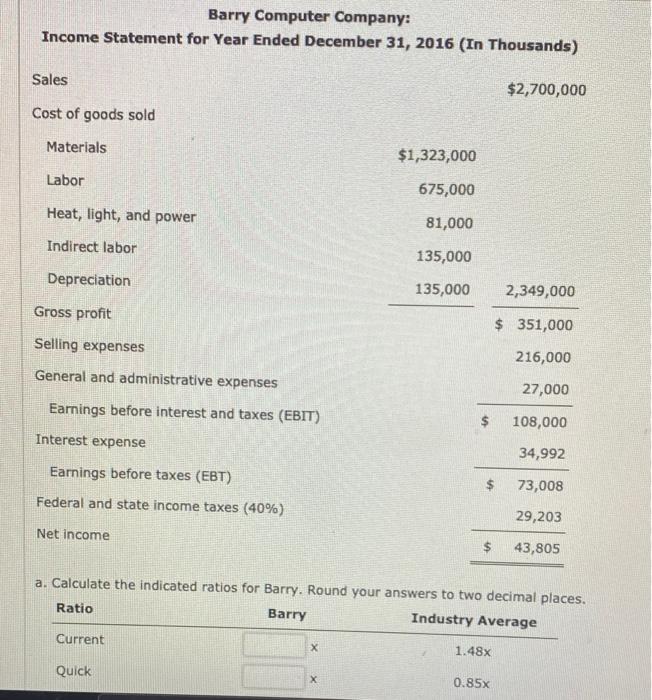
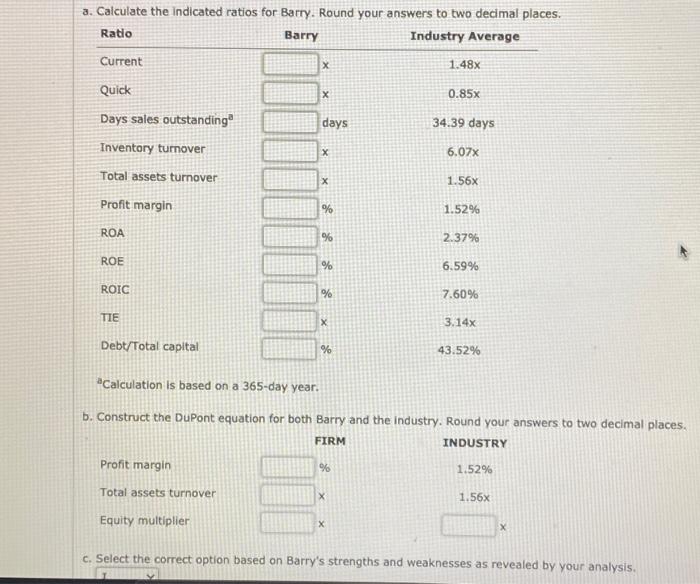
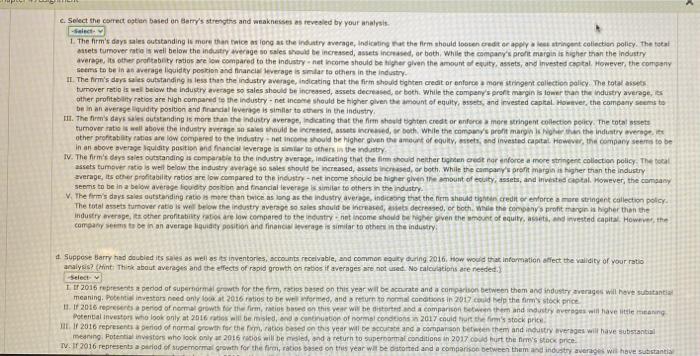
RATIO ANALYSIS Data for Barry Computer Co. and its industry averages follow. Barry Computer Company: Balance Sheet as of December 31, 2016 (In Thousands) Cash $174,960 Accounts payable $311,040 Receivables 544,320 Other current liabilities 311,040 Inventories 466,560 Notes payable to bank 194,400 Total current assets $1,185,840 Total current liabilities $816,480 Long-term debt $388,800 Net fixed assets 758,160 Common equity 738,720 Total assets $1,944,000 Total liabilities and equity $1,944,000 Barry Computer Company: Income Statement for Year Ended December 31, 2016 (In Thousands) Sales $2,700,000 Cost of goods sold Materials $1,323,000 Labor 675,000 Heat, light, and power 81,000 Indirect labor 135,000 Depreciation 135,000 2,349,000 Barry Computer Company: Income Statement for Year Ended December 31, 2016 (In Thousands) Sales $2,700,000 Cost of goods sold Materials $1,323,000 Labor 675,000 Heat, light, and power 81,000 Indirect labor 135,000 Depreciation 135,000 2,349,000 Gross profit $ 351,000 Selling expenses General and administrative expenses 216,000 27,000 Earnings before interest and taxes (EBIT) $ 108,000 Interest expense 34,992 Earnings before taxes (EBT) $ 73,008 Federal and state income taxes (40%) 29,203 Net income $ 43,805 a. Calculate the indicated ratios for Barry. Round your answers to two decimal places. Ratio Barry Industry Average Current 1.48x Quick 0.85x a. Calculate the Indicated ratios for Barry. Round your answers to two decimal places. Ratio Barry Industry Average Current 1.48x Quick X 0.85x days 34.39 days 6.07x Days sales outstanding Inventory turnover Total assets turnover Profit margin 1.56x % 1.52% ROA % 2.37% ROE % 6.59% ROIC % 7.60% TIE X 3.14x Debt/Total capital % 43.52% FIRM *Calculation is based on a 365-day year. b. Construct the DuPont equation for both Barry and the industry. Round your answers to two decimal places. INDUSTRY Profit margin 1.52% Total assets turnover 1.56x Equity multiplier % X c. Select the correct option based on Barry's strengths and weaknesses as revealed by your analysis, c. Select the correct option based on Barry's strengths and weaknesses as revealed by your analysis 1. The firm's days sales outstanding is more than twice as long as the industry average, indicating at the firm should be creditor applestringent collection policy. The total Mets turnover ratio is well below the industry werage so sales be increased, assets innse, or both. While the company's profit margin is higher than the industry average. Its other profitability ratios we low compared to the industry not come should be higher given the amount ofequity, assets, and invested crotal. However, the company seems to be in an average liquidity position and financierage is similar to others in the industry. IIThe firm's days sales outstanding is less than the industry average, indicating that the firm should tighten credit or enforce a more stringent collection policy. The totala tumover ratio is wel below the industry average so sales should be increased, assets decreased or both. While the company's profit margin is lower than the industry average, other profitability ratios are high compared to the industry.net icone should be higher given the amount of equity, sets, and invested capital. However, the company seems to be in an average nudity position and financial leverage is similar to others in the industry III. The firm's days outstanding is more than the industry average, indicating that the firm should be credit or enforcemere stringent collection policy. The total assets turnover ratio is well above the industry average so should be increased, assets inred, or both. While the company profit margin her han the industry average other profitability rates are low compared to the industry net income should be higher given the amount of equity, ets, and invested capital. However, the company seems to be in an above average quidity position and financial leverage a sima to others in the industry IV. The firm's desses outstanding is comparable to the industry average indicating that the film should neither than creditorenforce a more stringent collection policy. The total assets turnoveratie is well below the industry average so sales should be increased, assets incased, or both. While the company's prontmargin is higher than the industry average, its other profitability ratios are low compared to the industry.net income should be higher given the amount of culty, assets, and invested crotal. However, the company seems to be in a below average oudity position and financial leverage is similar to others in the industry. The firm's days sautstanding ratio mire than twice as long as the industry average, indicaong that the firm should it creditorenforce a more stringent collection policy The total assets turnover ratio is well below the industry average se sales should be increased, es decreased, or both. While the company profit margin is higher than the industry average, its other profitability to are low compared to the industry.net income should be her yven the amount of equily, ass, and invested capital. However, the company to be in an average liquidity position and financial leverage is similar to other in the industry 4. Suppose Barry had doubled its sales as well as its inventories, accounts receivable, and common outyuring 2016. How would that information affect the validity of your ratio analysis (Hint: Think about averages and the effects of rapid growth on ratios if averages are not used. No calculations are needed. Select I 2016 represent period of supernormal growth for the formats based on this year wit be accurate and a comparison between them and industry averages will have substantial meaning. Poet investors need only look at 2016 roties to be formed and return to roma conditions in 2017 could help the firm's stock price 11. I 2016 represents a period of normal growth for the firm, is based on this year will be on a comparison them and industry averages will have little meaning Potential investors who look only at 2016 will mised, and a continuation of mal conditions 2017 could hurt the firm's stock price I 2016 represents a period of normal growth for them, ratios based on this year will be course and a comparison between them and industry averages will have substantia meaning Potential investors who look only 2016 De misted, and a return to superoormal conditions in 2017 cod hurt there's stone IV. I 2016 represents a pad of supernormal growth for the fire, rabios based on this year wat be stored and a comparison between them and industry average wil have substantia
Step by Step Solution
There are 3 Steps involved in it

Get step-by-step solutions from verified subject matter experts