

Question: Ratio analysis for the ratios shown in Table 1 in the Guide to Case Analysis (CA) of the textbook: Profitability ratios Liquidity ratios Leverage ratios
- Ratio analysis for the ratios shown in Table 1 in the Guide to Case Analysis (CA) of the textbook:
- Profitability ratios
- Liquidity ratios
- Leverage ratios
- Activity ratios
- Price-to-earnings ratio
- The changes between years are included in the calculations
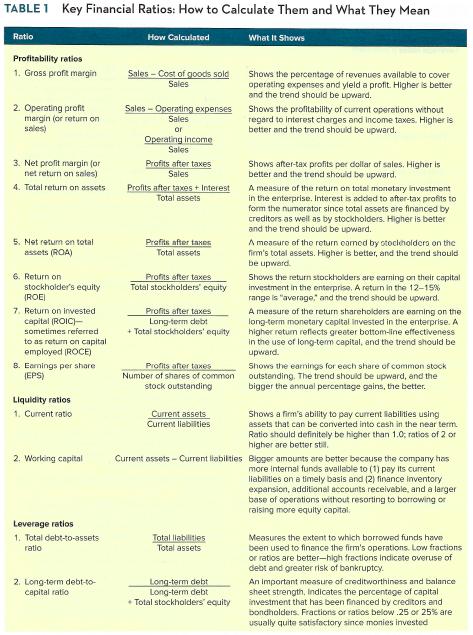
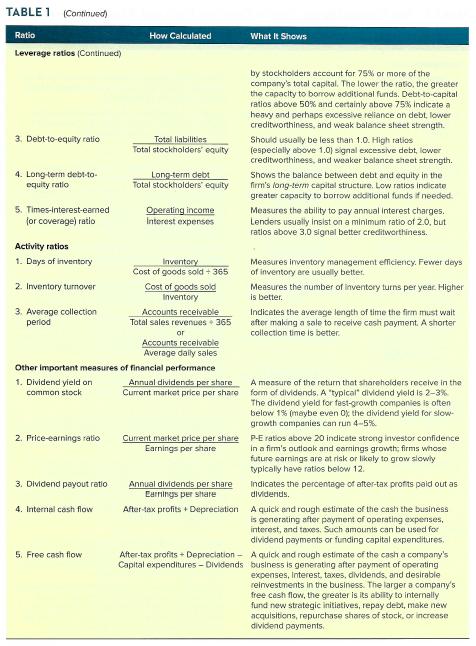
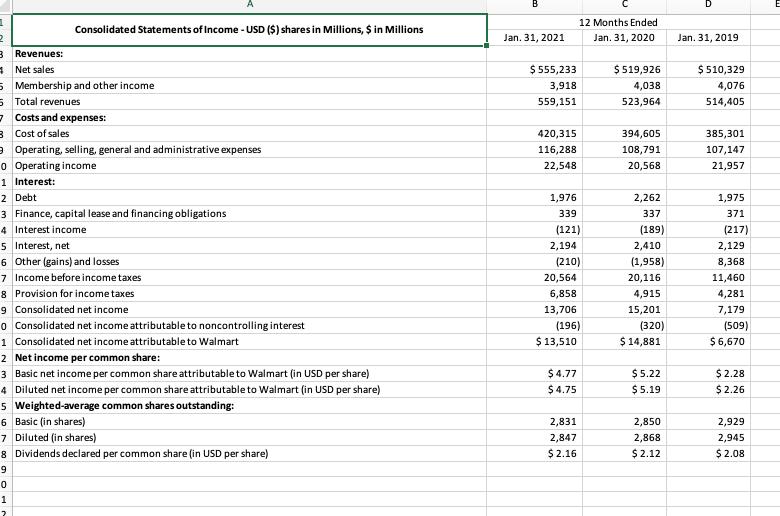
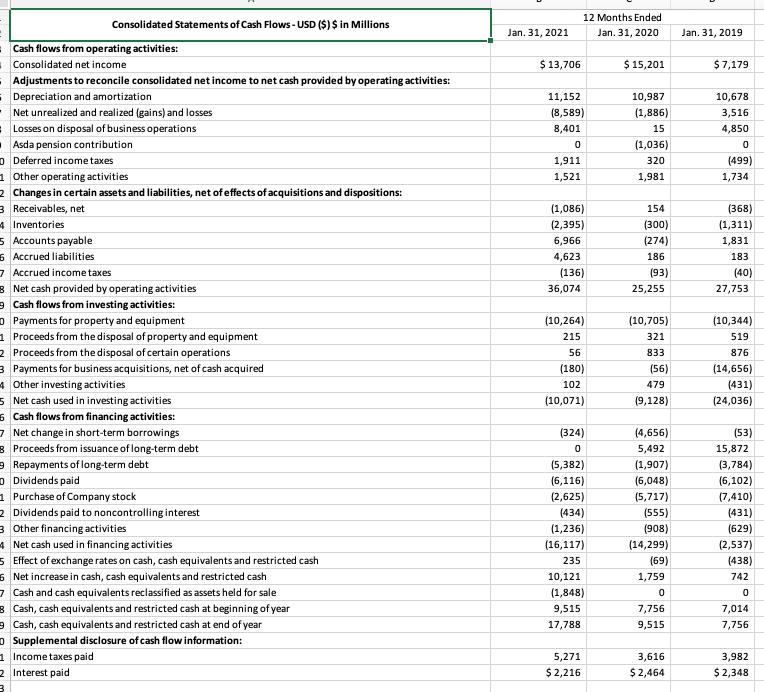
TABLE 1 Key Financial Ratios: How to Calculate Them and What They Mean Ratio Profitability ratios 1. Gross profit margin 2. Operating profit margin (or return on sales) 3. Net profit margin (or net return on sales) 4. Total return on assets 5. Net retum on total assets (ROA) 6. Return on stockholder's equity (ROE) 7. Return on invested capital (ROIC)- sometimes referred to as return on capital employed (ROCE) 8. Earnings per share (EPS) Liquidity ratios 1. Current ratio 2. Working capital Leverage ratios 1. Total debt-to-assets ratio 2. Long-term debt-to- capital ratio How Calculated Sales-Cost of goods sold Sales Sales-Operating expenses Sales or Operating income Sales Profits after taxes Sales Profits after taxes + Interest Total assets Profits after taxes Total assets Profits after taxes Total stockholders' equity Profits after taxes Long-term debt + Total stockholders' equity Profits after taxes Number of shares of common stock outstanding Current assets Current liabilities Total liabilities Total assets What It Shows Long-term debt Long-term debt Total stockholders' equity Shows the percentage of revenues available to cover operating expenses and yield a profit. Higher is better and the trend should be upward. Shows the profitability of current operations without regard to interest charges and income taxes. Higher is better and the trend should be upward. Shows after-tax profits per dollar of sales. Higher is better and the trend should be upward. A measure of the return on total monetary investment in the enterprise. Interest is added to after-tax profits to form the numerator since total assets are financed by creditors as well as by stockholders. Higher is better and the trend should be upward. A measure of the return carned by stockholders on the firm's total assets. Higher is better, and the trend should be upward. Shows the return stockholders are earning on their capital investment in the enterprise. A return in the 12-15% range is "average, and the trend should be upward. A measure of the return shareholders are earning on the long-term monetary capital invested in the enterprise. A higher return reflects greater bottom-line effectiveness in the use of long-term capital, and the trend should be upward. Shows the earnings for each share of common stock outstanding. The trend should be upward, and the bigger the annual percentage gains, the better. Current assets - Current liabilities Bigger amounts are better because the company has more internal funds available to (1) pay its current liabilities on a timely basis and (2) finance Inventory expansion, additional accounts receivable, and a larger base of operations without resorting to borrowing or raising more equity capital. Shows a firm's ability to pay current abilities using assets that can be converted into cash in the near term. Ratio should definitely be higher than 1.0; ratios of 2 or higher are better still. Measures the extent to which borrowed funds have been used to finance the firm's operations. Low fractions or ratios are better-high fractions indicate overuse of debt and greater risk of bankruptcy. An important measure of creditworthiness and balance sheet strength, Indicates the percentage of capital investment that has been financed by creditors and bondholders. Fractions or ratios below .25 or 25% are usually quite satisfactory since monies invested
Step by Step Solution
3.41 Rating (151 Votes )
There are 3 Steps involved in it
Sales 55523300 51992600 51032900 COGS 42031500 39460500 38530100 Operating Income 2254800 2056800 21... View full answer

Get step-by-step solutions from verified subject matter experts