

Question: Ratio Analysis PLEASE SHOW ME THE WORK ON EXCEL. 1 2019 2018 Please calculate following ratios for the year of 2019 $65,000 $150,000 $135,000 $9,700
Ratio Analysis
PLEASE SHOW ME THE WORK ON EXCEL.
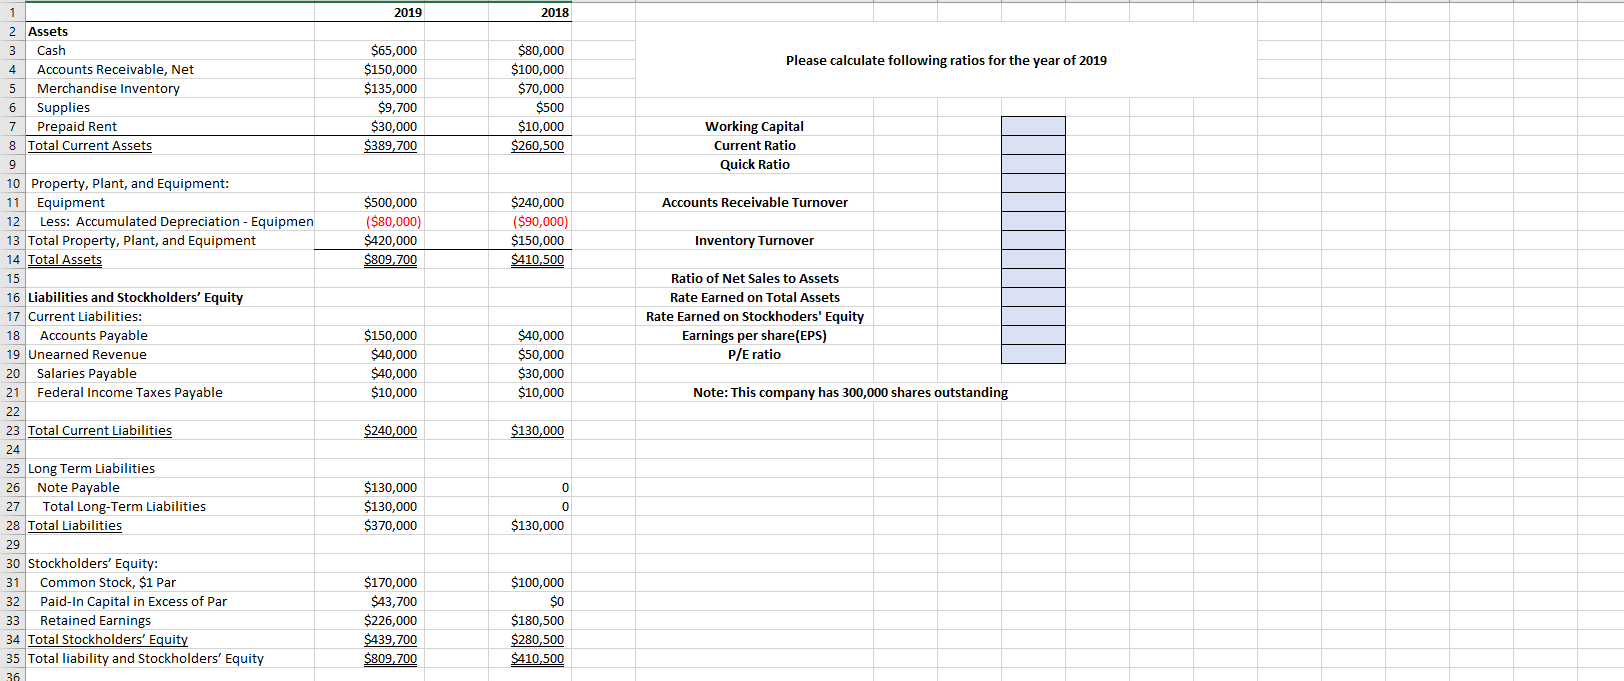
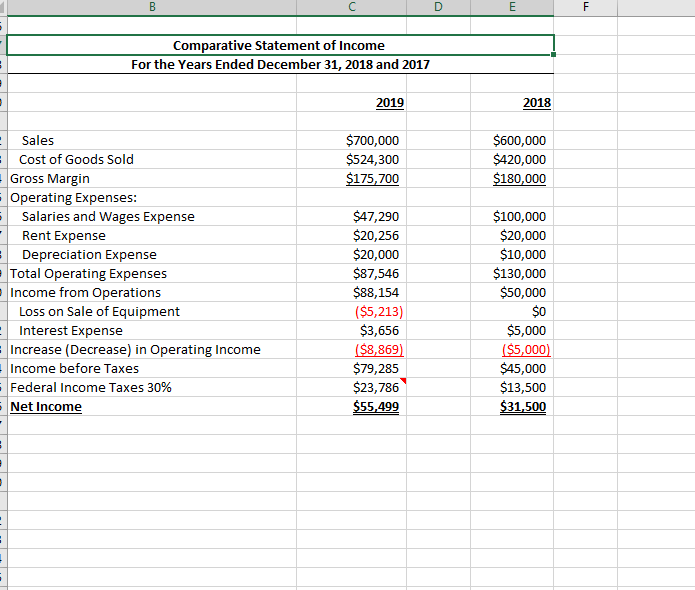
1 2019 2018 Please calculate following ratios for the year of 2019 $65,000 $150,000 $135,000 $9,700 $30,000 $389, 700 $80,000 $100,000 $70,000 $500 $10,000 $260,500 Working Capital Current Ratio Quick Ratio Accounts Receivable Turnover $500,000 ($80,000) $420,000 $809,700 $240,000 ($90,000) $150,000 $410,500 Inventory Turnover 2 Assets 3 Cash 4 Accounts Receivable, Net 5 Merchandise Inventory 6 Supplies 7 Prepaid Rent 8 Total Current Assets 9 10 Property, Plant, and Equipment: 11 Equipment 12 Less: Accumulated Depreciation - Equipmen 13 Total Property, Plant, and Equipment 14 Total Assets 15 16 Liabilities and Stockholders' Equity 17 Current Liabilities: 18 Accounts Payable 19 Unearned Revenue 20 Salaries Payable 21 Federal Income Taxes Payable 22 23 Total Current Liabilities 24 25 Long Term Liabilities 26 Note Payable 27 Total Long-Term Liabilities 28 Total Liabilities 29 30 Stockholders' Equity: 31 Common Stock, $1 Par 32 Paid-In Capital in Excess of Par 33 Retained Earnings 34 Total Stockholders' Equity 35 Total liability and Stockholders' Equity 36 Ratio of Net Sales to Assets Rate Earned on Total Assets Rate Earned on Stockhoders' Equity Earnings per share(EPS) P/E ratio $150,000 $40,000 $40,000 $10,000 $40,000 $50,000 $30,000 $10,000 Note: This company has 300,000 shares outstanding $240,000 $130,000 $130,000 $130,000 $370,000 0 0 $130,000 $170,000 $43,700 $226,000 $439,700 $809,700 $100,000 $0 $180,500 $280,500 $410,500 B E F Comparative Statement of Income For the Years Ended December 31, 2018 and 2017 2019 2018 $700,000 $524,300 $175,700 $600,000 $420,000 $180,000 Sales Cost of Goods Sold Gross Margin Operating Expenses: Salaries and Wages Expense Rent Expense Depreciation Expense = Total Operating Expenses - Income from Operations Loss on Sale of Equipment Interest Expense Increase (Decrease) in Operating Income Income before Taxes Federal Income Taxes 30% Net Income $47,290 $20,256 $20,000 $87,546 $88,154 ($5,213) $3,656 ($8,869) $79,285 $23,786 $55,499 $100,000 $20,000 $10,000 $130,000 $50,000 $0 $5,000 ($5,000) $45,000 $13,500 $31,500
Step by Step Solution
There are 3 Steps involved in it

Get step-by-step solutions from verified subject matter experts