

Question: ratio analysis SAKURA BERHAD has prepared the following comparative statement of financial position and the Statement of Comprehensive Income as follows: SAKURA BERHAD Comparative Statements
ratio analysis
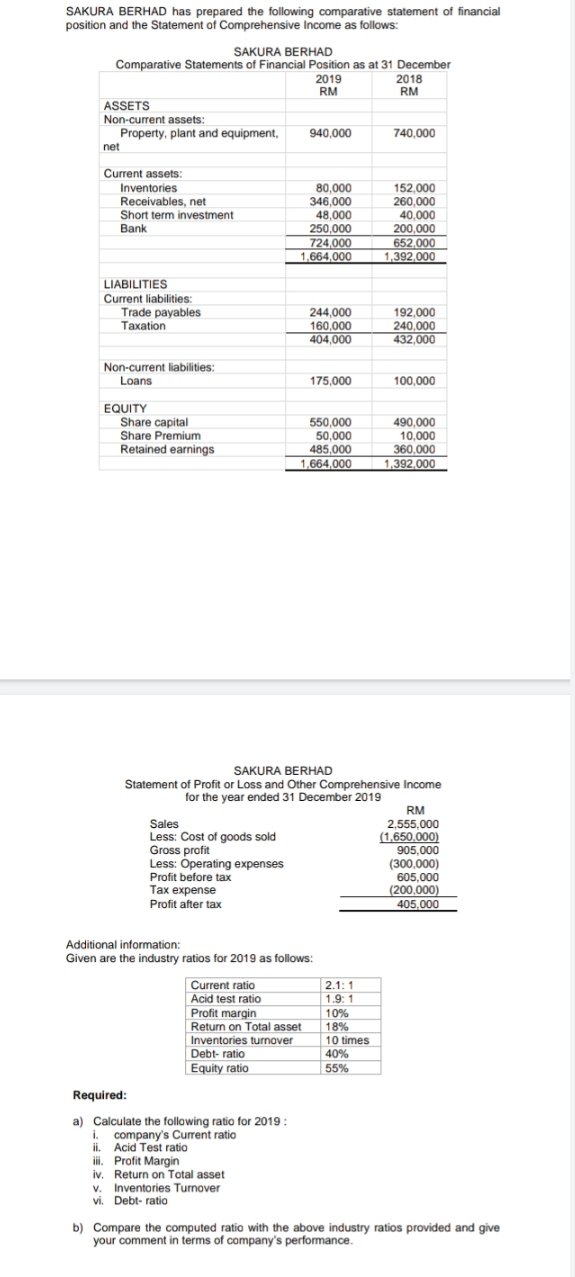
SAKURA BERHAD has prepared the following comparative statement of financial position and the Statement of Comprehensive Income as follows: SAKURA BERHAD Comparative Statements of Financial Position as at 31 December 2019 2018 RM RM ASSETS Non-current assets: Property, plant and equipment, 940,000 740,000 net Current assets: Inventories 80,000 152,000 Receivables, net 346,000 260,000 Short term investment 48,000 40,000 Bank 250,000 200,000 724,000 652,000 1,664,000 1,392,000 LIABILITIES Current liabilities: Trade payables 244,000 192,000 Taxation 160,000 240,000 404,000 432,000 Non-current liabilities: Loans 175,000 100,000 EQUITY Share capital 550,000 490,000 Share Premium 50,000 10,000 Retained earnings 485,000 360,000 1,664,000 1,392,000 SAKURA BERHAD Statement of Profit or Loss and Other Comprehensive Income for the year ended 31 December 2019 RM Sales 2,555,000 Less: Cost of goods sold (1,650.000) Gross profit 905,000 Less: Operating expenses (300,000) Profit before tax 605,000 Tax expense (200,000) Profit after tax 405,000 Additional information: Given are the industry ratios for 2019 as follows: Current ratio 2.1:1 Acid test ratio 1.9: 1 Profit margin 10% Return on Total asset 18% Inventories turnover 10 times Debt- ratio 40% Equity ratio 55% Required: a) Calculate the following ratio for 2019 : i. company's Current ratio ii. Acid Test ratio li. Profit Margin iv. Return on Total asset V. Inventories Turnover vi. Debt- ratio b) Compare the computed ratio with the above industry ratios provided and give your comment in terms of company's performance
Step by Step Solution
There are 3 Steps involved in it

Get step-by-step solutions from verified subject matter experts