

Question: Ratio Computation Complete the ratios using the data available for Automatic Data Processing (ADP.) Using actual financial statements introduces students to real world decisions. For
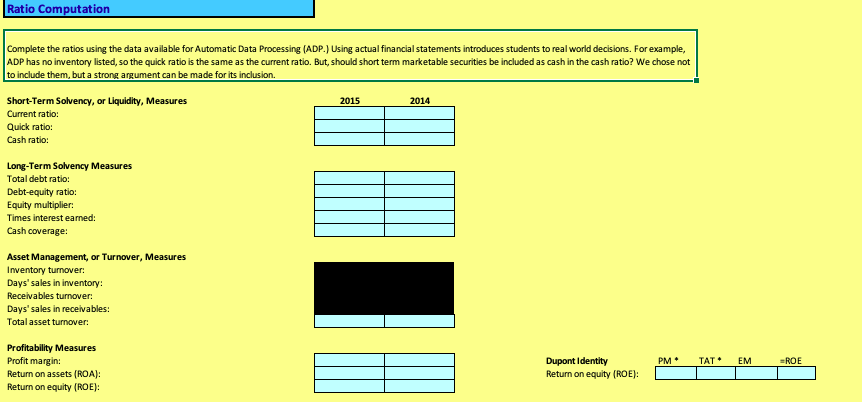
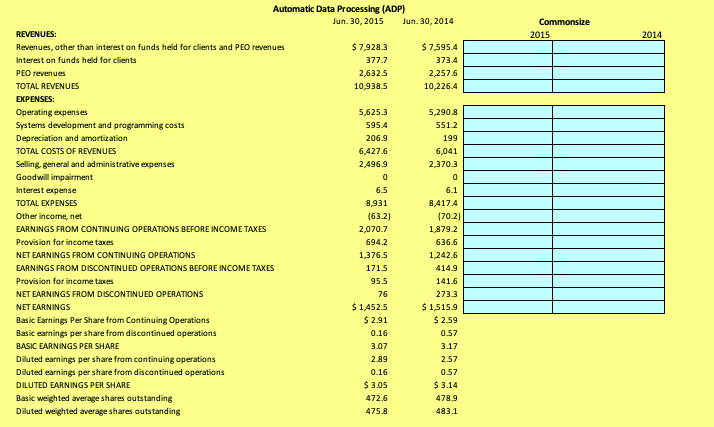
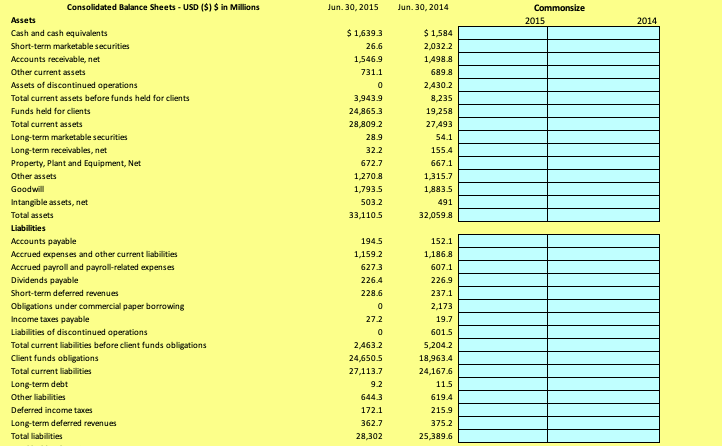
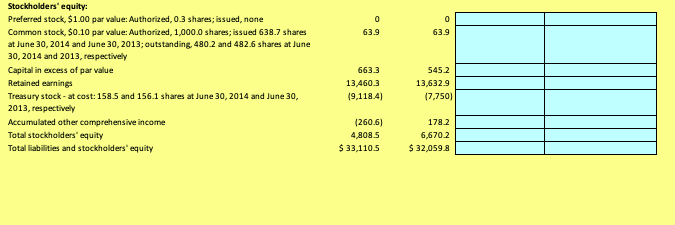
Ratio Computation Complete the ratios using the data available for Automatic Data Processing (ADP.) Using actual financial statements introduces students to real world decisions. For example, ADP has no inventory listed, so the quick ratio is the same as the current ratio. But, should short term marketable securities be included as cash in the cash ratio? We chose not to include them, but a strong argument can be made for its inclusion. 2015 2014 Short-Term Solvency, or Liquidity, Measures Current ratio: Quick ratio: Cash ratio: Long-Term Solvency Measures Total debt ratio: Debt-equity ratio: Equity multiplier: Times interest earned: Cash coverage: Asset Management, or Turnover, Measures Inventory turnover: Days' sales in inventory: Receivables turnover: Days' sales in receivables: Total asset turnover: PM TAT EM ROE Profitability Measures Profit margin: Return on assets (ROA): Return on equity (ROE): Dupont Identity Return on equity (ROE): Commonsize 2015 2014 Automatic Data Processing (ADP) Jun 30, 2015 Jun 30, 2014 REVENUES: Revenues, other than interest on funds held for clients and PEO revenues $ 7,9283 $ 7,595.4 Interest on funds held for clients 377.7 373.4 PEO revenues 2,6325 2,257.6 TOTAL REVENUES 10,938.5 10,226.4 EXPENSES: Operating expenses 5,6253 5.290.8 Systems development and programming costs 595.4 5512 Depreciation and amortization 206.9 199 TOTAL COSTS OF REVENUES 6.427.6 6,041 Selling, general and administrative expenses 2,496.9 2,3703 Goodwill impairment Interest expense 6.5 TOTAL EXPENSES 8.931 8,417.4 Other income, net (63.2) (70.2) EARNINGS FROM CONTINUING OPERATIONS BEFORE INCOME TAXES 2,070.7 1879 2 Provision for income taxes 6942 636.6 NET EARNINGS FROM CONTINUING OPERATIONS 1 3765 1,242.6 EARNINGS FROM DISCONTINUED OPERATIONS BEFORE INCOME TAXES 1715 414.9 Provision for income taxes 141.6 NET EARNINGS FROM DISCONTINUED OPERATIONS 2733 NET EARNINGS $1.4525 $ 1515.9 Basic Earnings Per Share from Continuing Operations $ 2.91 $ 2.59 Basic earnings per share from discontinued operations 0.16 0.57 BASIC EARNINGS PER SHARE 3.07 3.17 Diluted earnings per share from continuing operations 2.89 2.57 Diluted earnings per share from discontinued operations 0.16 0.57 DILUTED EARNINGS PER SHARE $ 3.05 $ 3.14 Basic weighted average shares outstanding 472.6 478.9 Diluted weighted average shares outstanding 475.8 433.1 955 Jun 30, 2015 Jun 30, 2014 2015 $ 1,639.3 26.6 1,546,9 7311 3.943.9 24.865.3 28,8092 28.9 $ 1,584 2,0322 1,498.8 6893 2430.2 8.235 19.258 27493 541 155.4 6671 1,315.7 1,883.5 491 32,0598 122 672.7 1.270.8 1.7935 5032 33,1105 Consolidated Balance Sheets - USD ($) $ in Millions Assets Cash and cash equivalents Short-term marketable securities Accounts receivable, net Other current assets Assets of discontinued operations Total current assets before funds held for clients Funds held for clients Total current assets Long-term marketable securities Long-term receivables, net Property. Plant and Equipment, Net Other assets Goodwill Intangible assets, net Total assets Liabilities Accounts payable Accrued expenses and other current liabilities Accrued payroll and payroll-related expenses Dividends payable Short-term deferred revenues Obligations under commercial paper borrowing Income taxes payable Liabilities of discontinued operations Total current abilities before client funds obligations Client funds obligations Total current abilities Long-term debt Other abilities Deferred income taxes Long-term deferred revenues 1945 1,1592 6273 226.4 228.6 272 152.1 1,186.8 6071 2269 237.1 2.173 19.7 6015 5,2042 18,963.4 24,1676 115 6194 215.9 2.4632 24,650.5 27.113.7 9.2 6443 172.1 3627 28,302 3752 25,389.6 63.9 63.9 Stockholders' equity: Preferred stock $1.00 par value: Authorized, 0.3 shares; issued, none Common stock, $0.10 par value: Authorized, 1,000.0 shares; issued 638.7 shares at June 30, 2014 and June 30, 2013; outstanding, 480.2 and 482.6 shares at June 30, 2014 and 2013, respectively Capital in excess of par value Retained earnings Treasury stock - at cost: 158.5 and 156.1 shares at June 30, 2014 and June 30, 2013, respectively Accumulated other comprehensive income Total stockholders' equity Total liabilities and stockholders' equity 6633 13,4603 19,118.4) 5452 13,632.9 17,750) (260.6) 4,808.5 $ 33,1105 178.2 6,6702 $32,059.8
Step by Step Solution
There are 3 Steps involved in it

Get step-by-step solutions from verified subject matter experts