

Question: Rational Functions Mid-Unit Assignment Compiling Research Begin compiling research on your chosen topic. You will need: Background information on your career. To know how rational


![Your report should include: C] 1) Title Page C] 2) Abstract 0](https://s3.amazonaws.com/si.experts.images/answers/2024/06/6676bfd3aa25b_3876676bfd389133.jpg)
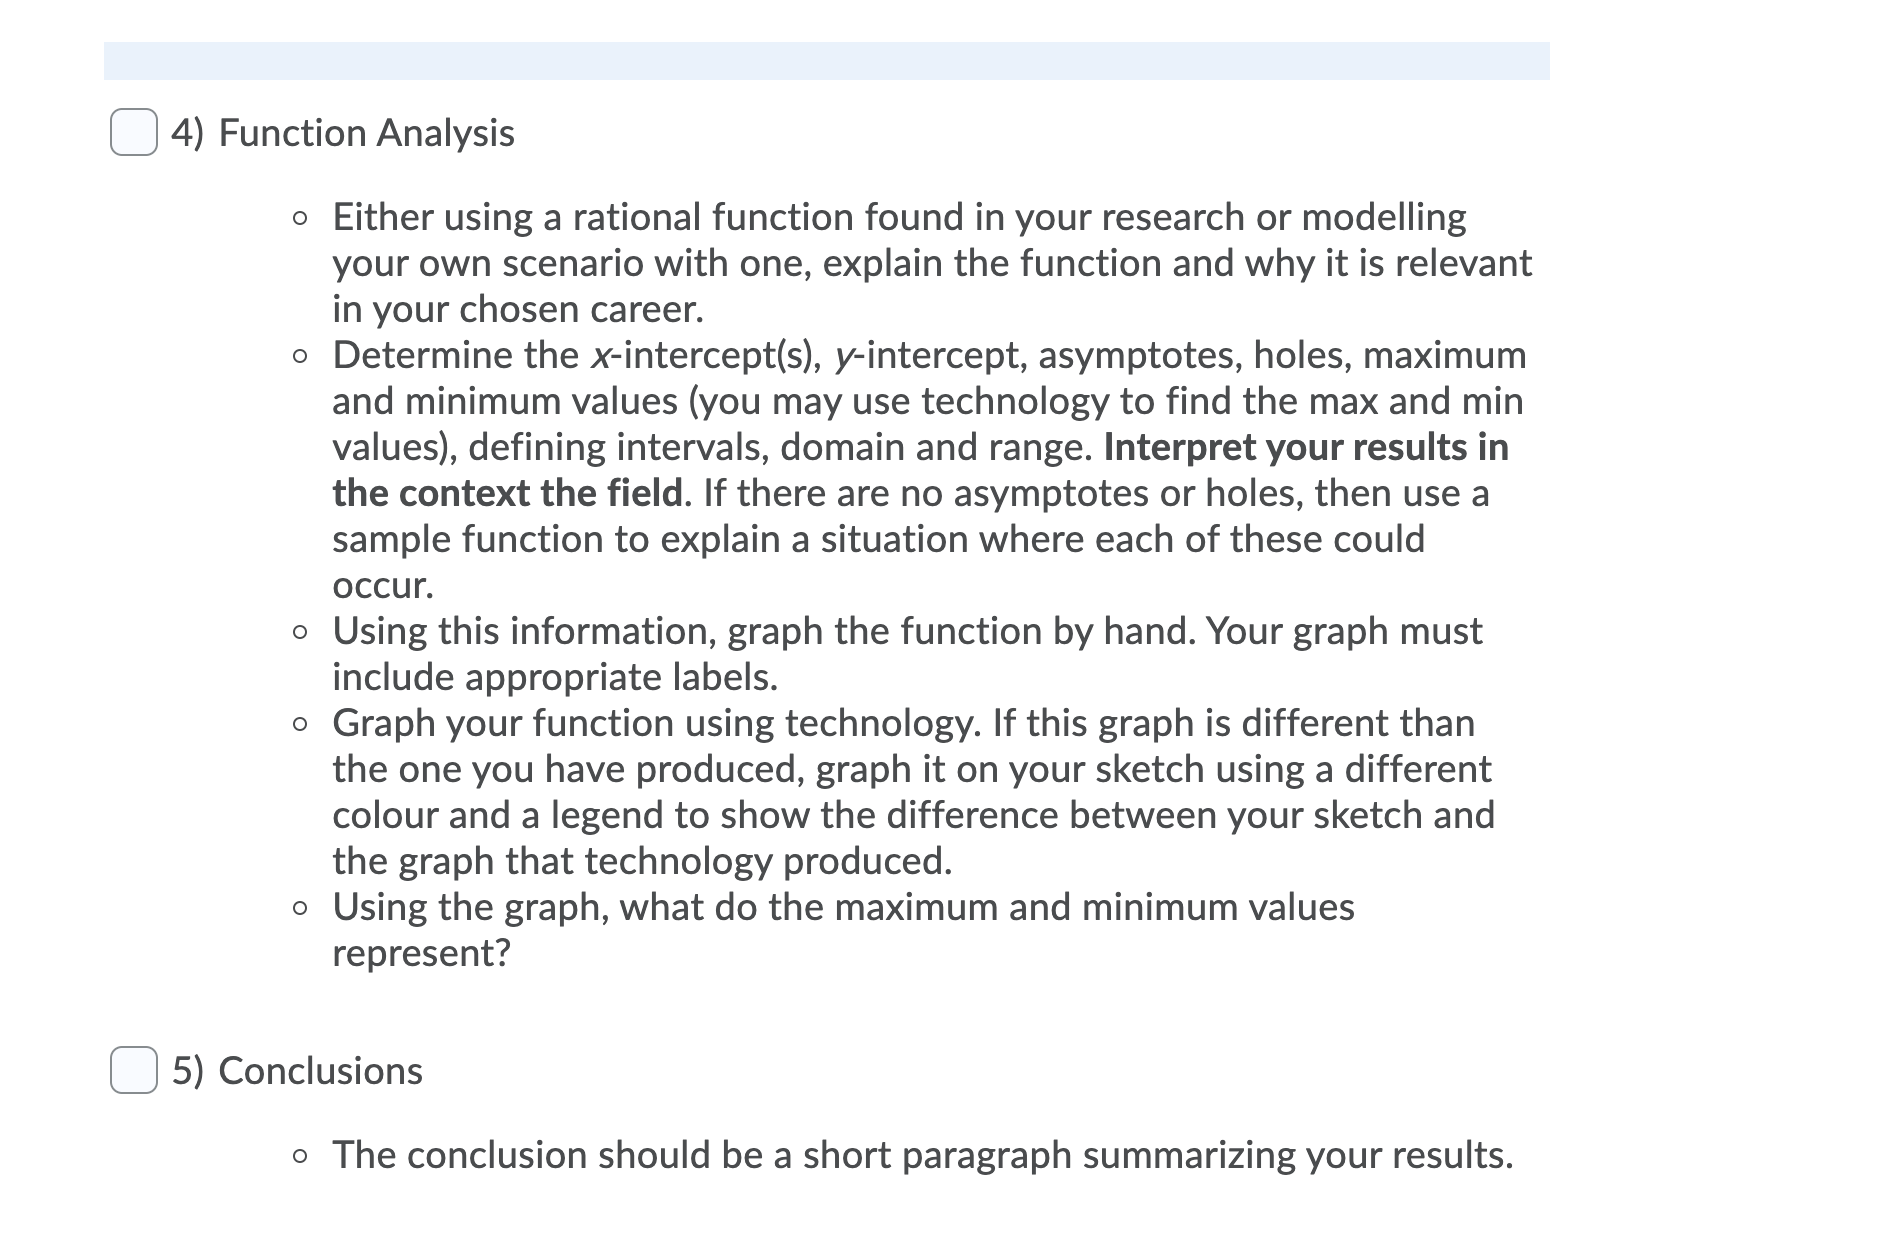
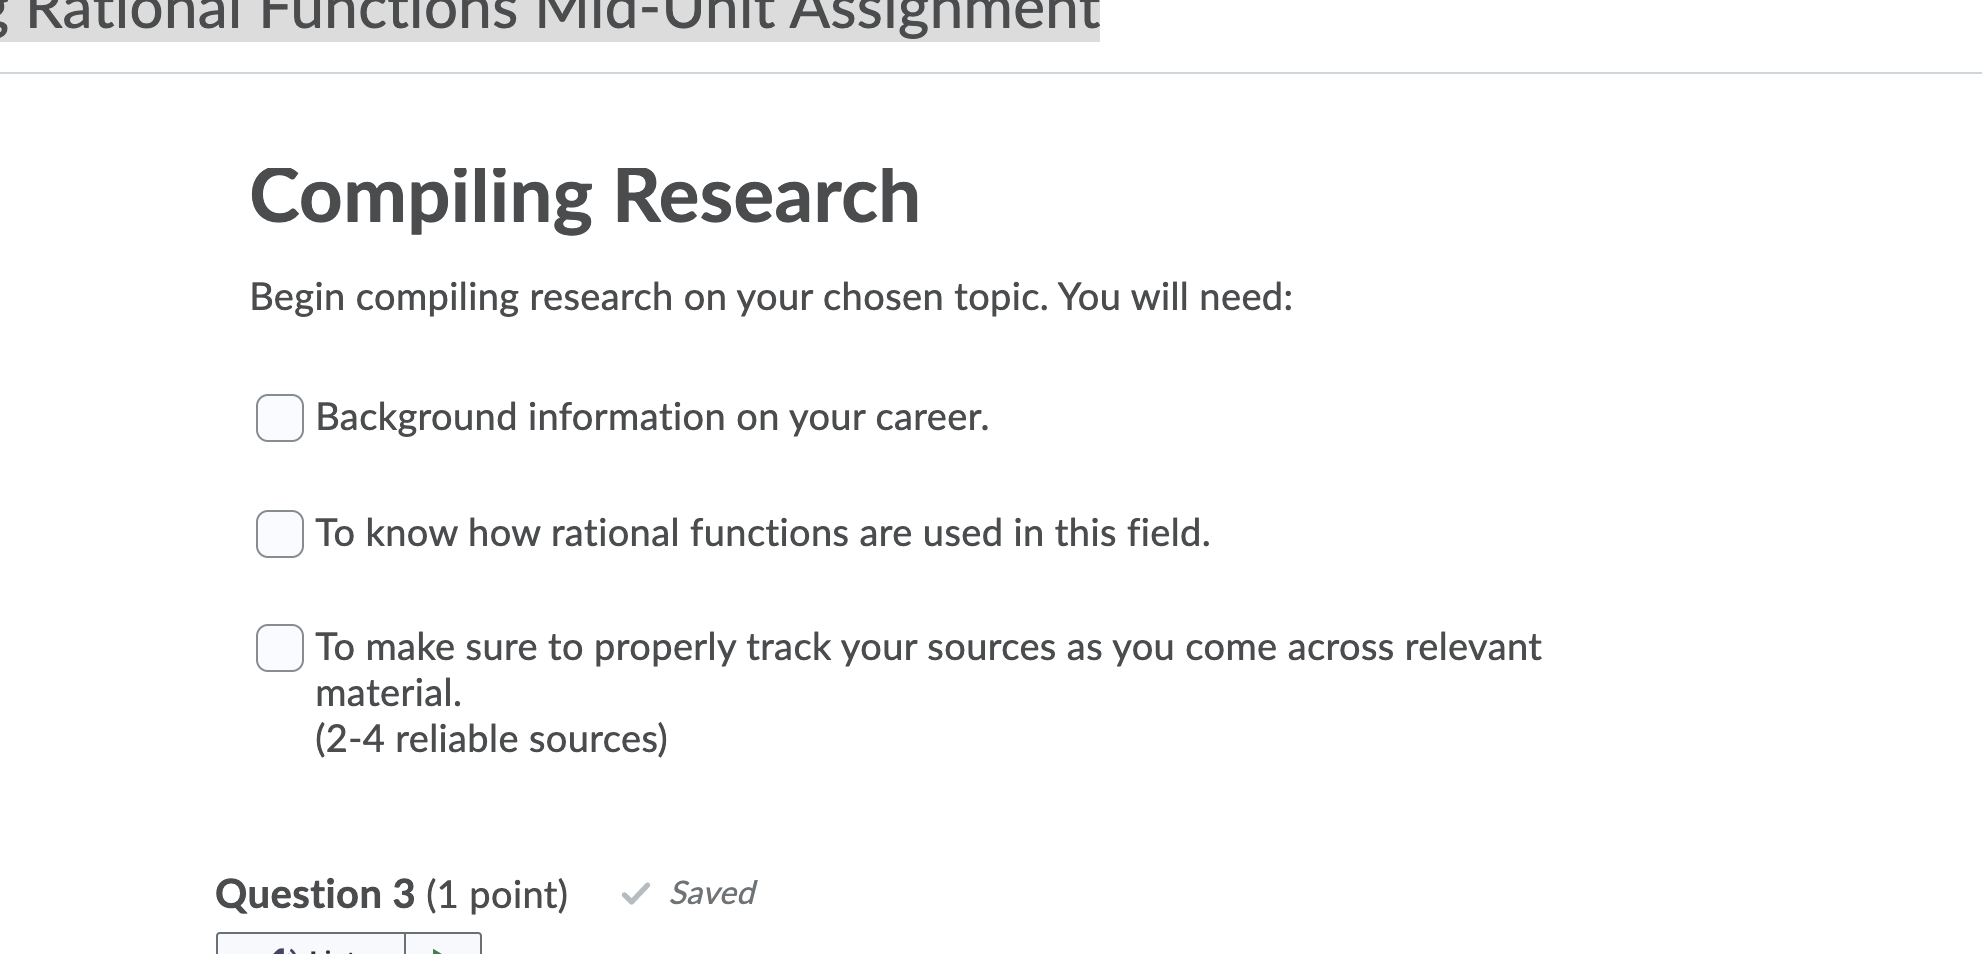
Rational Functions Mid-Unit Assignment Compiling Research Begin compiling research on your chosen topic. You will need: Background information on your career. To know how rational functions are used in this field. To make sure to properly track your sources as you come across relevant material. (2-4 reliable sources) Question 3 (1 point) SavedE 4)) Listen } Complete Your Report Your report should include: C] 1) Title Page C] 2) Abstract 0 Your abstract should include an overview on everything you are going to cover in your report (a concise paragraph of up to 150 words) 3) Introduction 0 The introduction should include all the background information on your chosen career, such as what type of education you need to obtain this job? What duties are performed on a daily basis? What is the average salary? How is math and specifically, rational functions used in this profession? (up to 3 pages) /I\\ Euaatb'n A y'all-r:h C] 4) Function Analysis 0 Either using a rational function found in your research or modelling your own scenario with one, explain the function and why it is relevant in your chosen career. Determine the Xintercept(s), yintercept, asymptotes, holes, maximum and minimum values (you may use technology to find the max and min values), defining intervals, domain and range. Interpret your results in the context the field. If there are no asymptotes or holes, then use a sample function to explain a situation where each of these could occur. Using this information, graph the function by hand. Your graph must include appropriate labels. Graph your function using technology. If this graph is different than the one you have produced, graph it on your sketch using a different colour and a legend to show the difference between your sketch and the graph that technology produced. Using the graph, what do the maximum and minimum values represent? C] 5) Conclusions 0 The conclusion should be a short paragraph summarizing your results
Step by Step Solution
There are 3 Steps involved in it

Get step-by-step solutions from verified subject matter experts