

Question: Ratios analysis for both Companies comparisons for each year/ quarters, 2019 to 2021 for Current Ratios Quick Ratios Debt to Equity Ratios Debt to capital
Ratios analysis for both Companies comparisons for each year/ quarters, 2019 to 2021 for
Current Ratios
Quick Ratios
Debt to Equity Ratios
Debt to capital
Asset to equity ratios
working capital
Equity turnover ratios
Gross Profit ratios
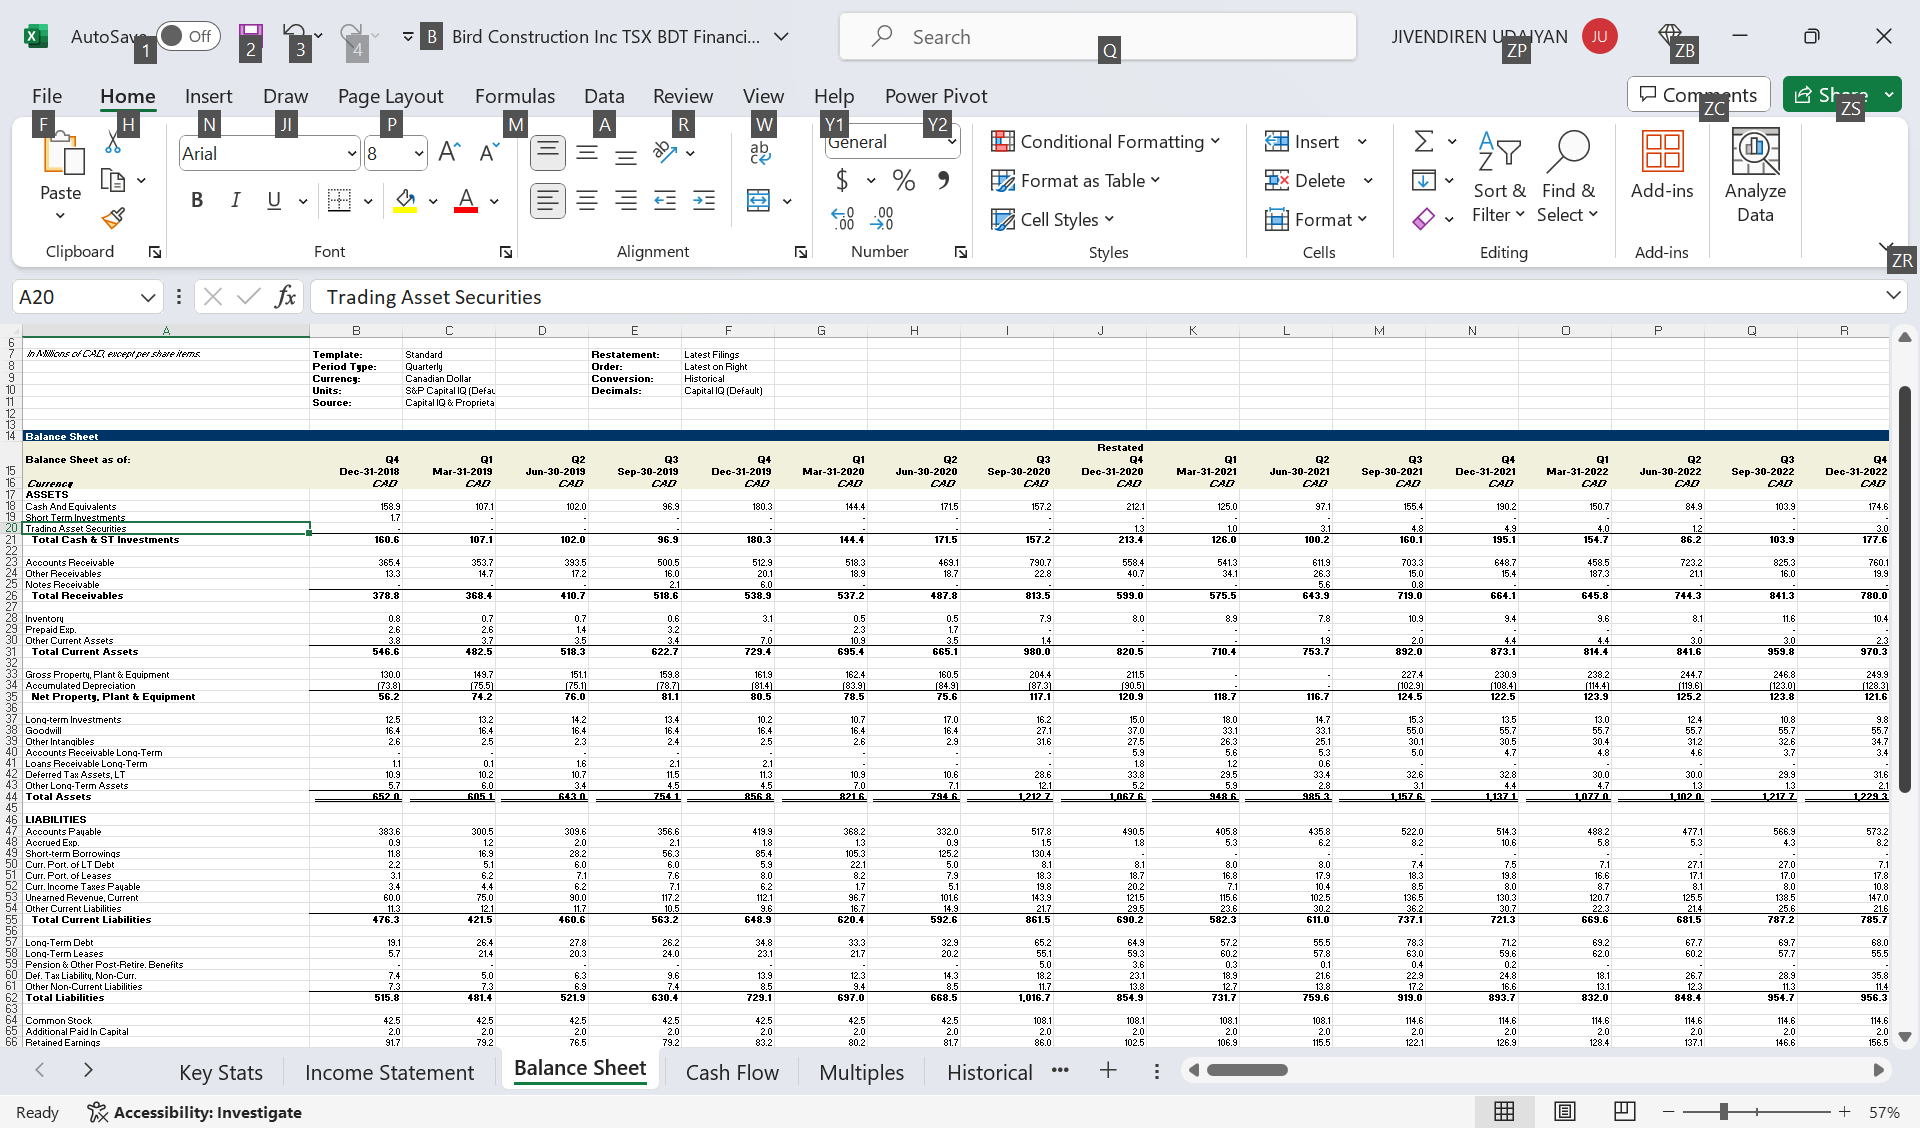
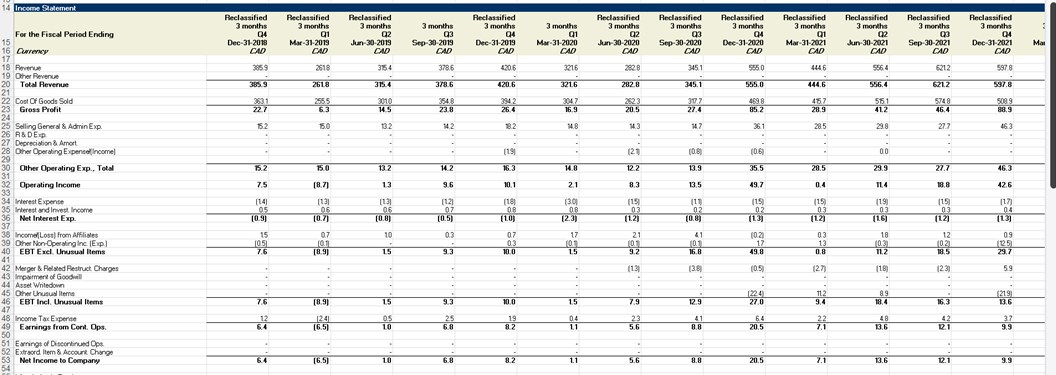
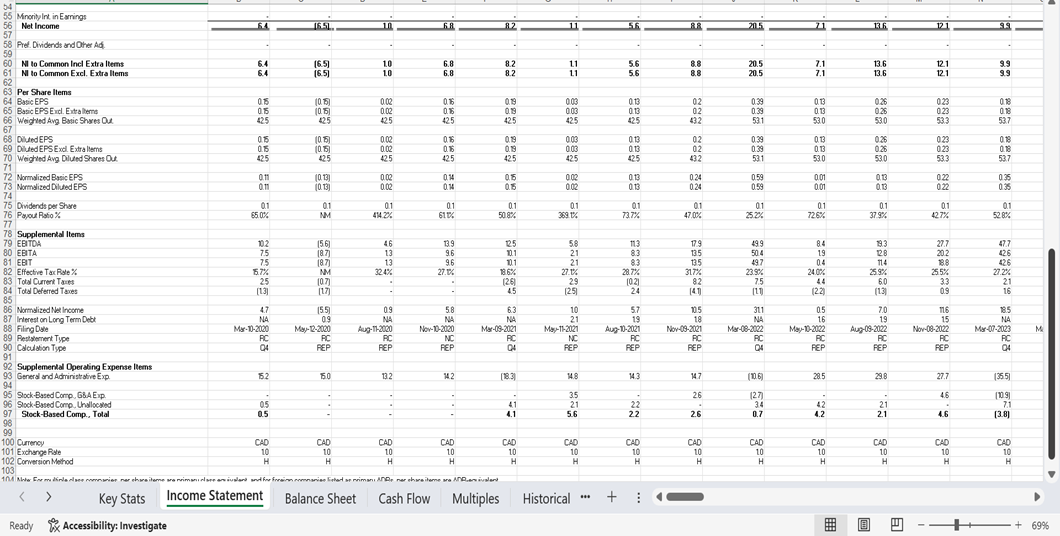
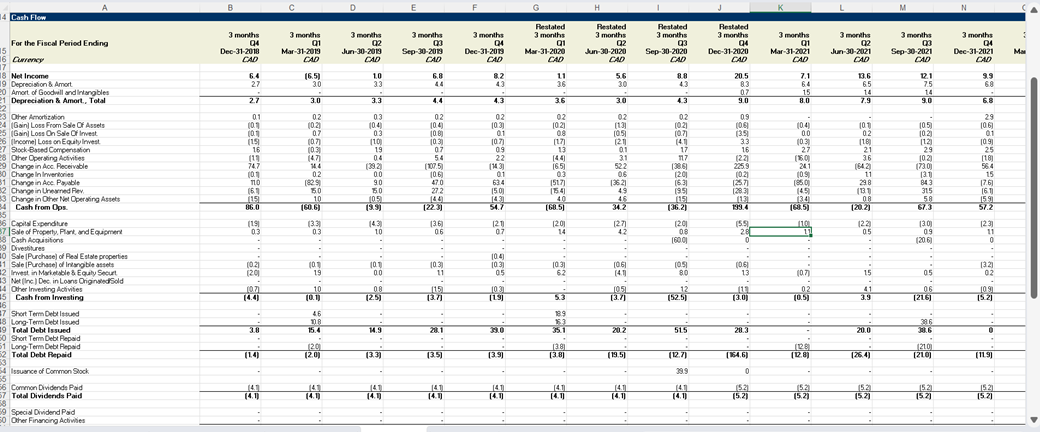
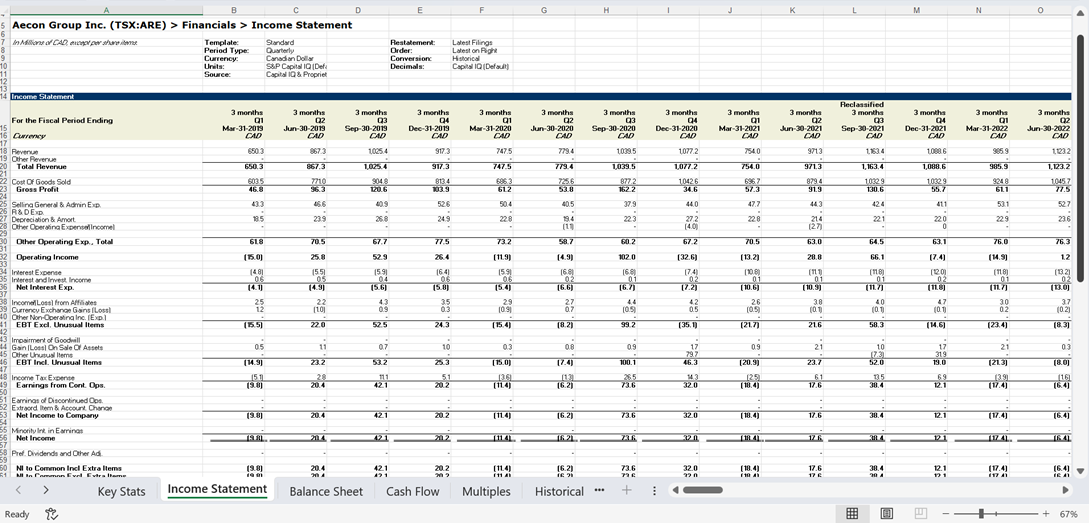
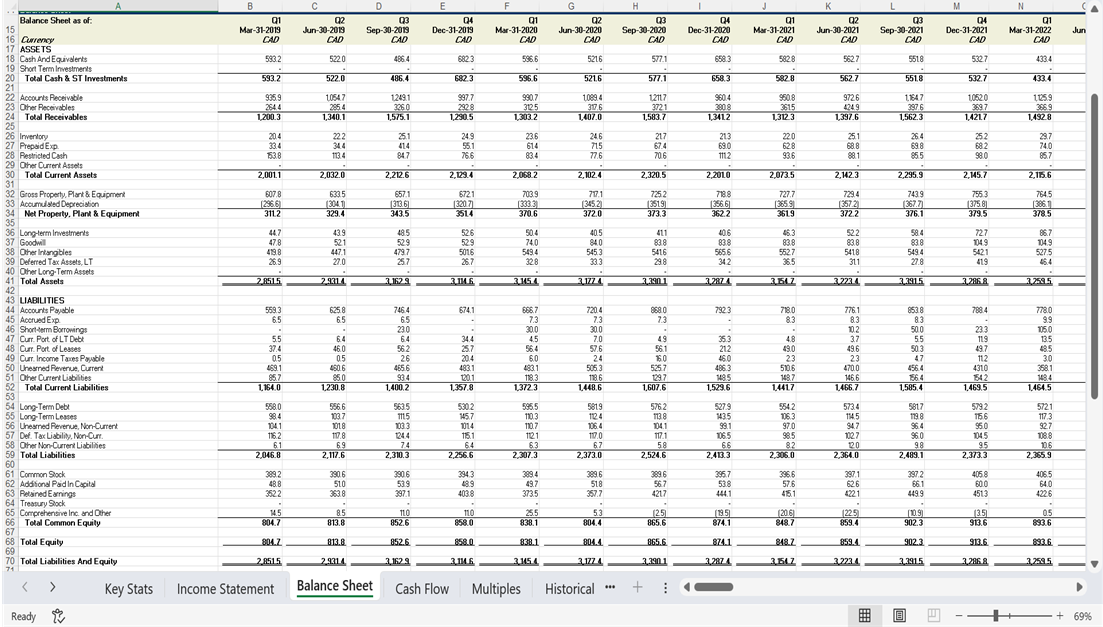
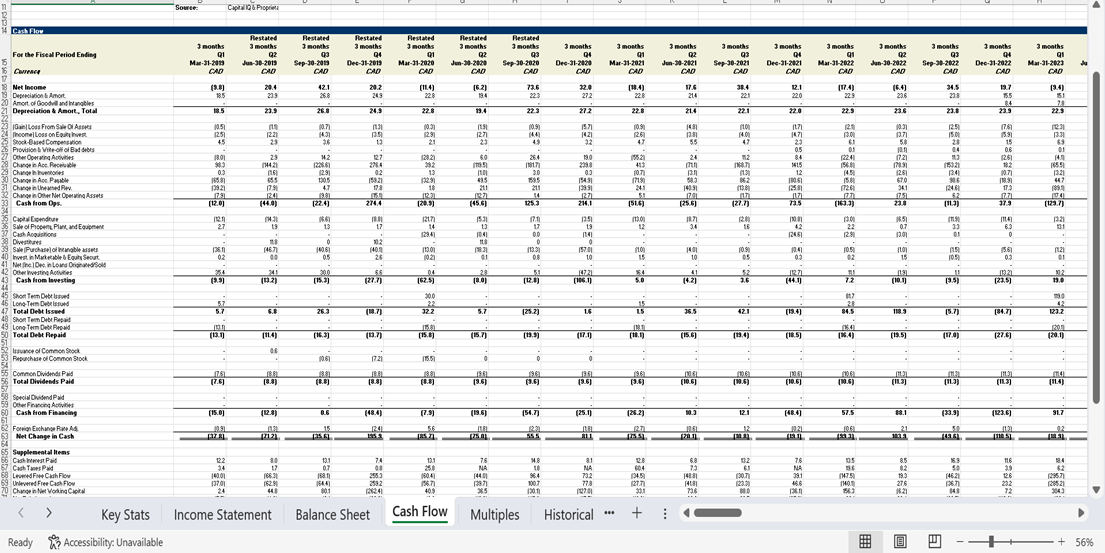
2 companies Bird Construction Inc. (TSX:BDT) and Aecon Group Inc. (TSX:ARE)
Financial statements provided, Balance sheet, cash flow, and income statement.
We need to get a comparison of ratios analysis and interpretation for each quarter from 2019 to 2021 in a table format.
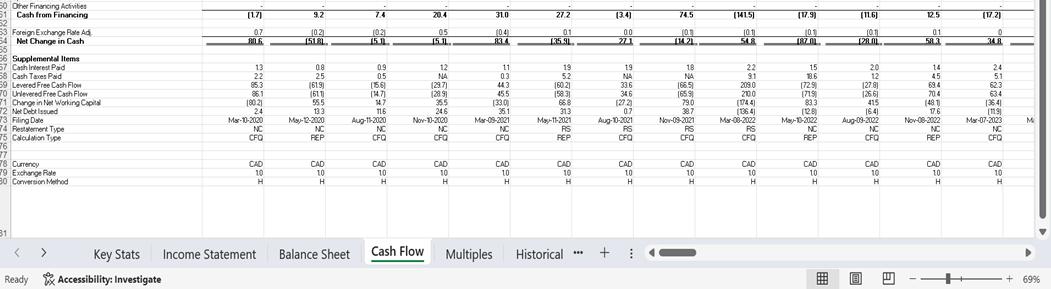
I have included all financial statements , format and resolution may not be perfect.
for all financial statement details refer to TSX Canada stock exchange or s&p capital iq where can download all statements
Note: they are In Millions of CAD, except per share items.
10 JIVENDIREN UDAIYAN JU ZP ZB Comments ZC AutoSave Off B Bird Construction Inc TSX BDT Financi... Search File F Home Insert Draw N P Page Layout Formulas Data M Review View Help Power Pivot R W Arial 8 ' ' ab Y1 General Y2 Conditional Formatting Insert ce $ % 9 Format as Table DX Delete Paste B I U Cell Styles Alignment Number Styles Format Cells A20 Clipboard A In Millions of CAD except per share items Font fx Trading Asset Securities B C Template: Period Type: Currency: Units: Source: Standard Quarterly Canadian Dollar S&P Capital IQ (Defau Capital IQ & Proprieta D E F G H Restatement: Order: Conversion: Decimals: Latest Filings Latest on Right Historical Capital IQ (Default) T Sort & Find & Add-ins Analyze Filter Select Data Editing Add-ins ZR J K L M N 0 P Q R 14 Balance Sheet Balance Sheet as of: Currence ASSETS Cash And Equivalents Restated Q4 Q1 Q2 Q3 Q4 Q1 02 Q3 Q1 02 Q3 Q4 Q1 02 Q3 Q4 Dec-31-2018 CAD Mar-31-2019 CAD Jun-30-2019 CAD Sep-30-2019 CAD Dec-31-2019 CAD Mar-31-2020 CAD Jun-30-2020 CAD Sep-30-2020 CAD Dec-31-2020 CAD Mar-31-2021 CAD Jun-30-2021 CAD 158.9 107. 102.0 96.9 180.3 144.4 171.5 157.2 212.1 125.0 Short Term Investments 1.7 - - 13 Trading Asset Securities 10 Total Cash & ST Investments 160.6 107.1 102.0 96.9 180.3 144.4 171.5 157.2 213.4 126.0 100.2 Accounts Receivable 365.4 353.7 393.5 500.5 512.9 518.3 469.1 790.7 558.4 541.3 Other Receivables 13.3 14.7 17.2 16.0 20.1 18.9 18.7 22.8 40.7 Notes Receivable Total Receivables Inventory Prepaid Exp. 2.1 378.8 368.4 410.7 518.6 538.9 537.2 487.8 813.5 599.0 575.5 643.9 0.8 0.7 0.7 3.1 0.5 7.9 8.0 8.9 2.6 1.4 2.3 1.7 Sep-30-2021 Dec-31-2021 Mar-31-2022 CAD CAD CAD Jun-30-2022 CAD Sep-30-2022 CAD Dec-31-2022 CAD 97.1 155.4 190.2 150.7 103.9 174.6 31 4.8 4.9 4.0 3.0 160.1 195.1 154.7 86.2 103.9 177.6 611.9 703.3 648 7 458.5 723.2 825.3 760.1 26.3 15.0 15.4 187.3 21.1 16.0 19.9 56 719.0 664.1 645.8 744.3 841.3 780.0 7.8 10.9 9.4 9.6 8.1 11.6 10.4 Other Current Assets 3.8 3.5 3.4 7.0 10.9 1.4 1.9 2.0 4.4 3.0 2.3 79.4 Total Current Assets 546.6 482.5 518.3 622.7 729.4 695.4 665.1 980.0 820.5 710.4 753.7 892.0 873.1 814.4 841.6 959.8 970.3 Gross Property, Plant & Equipment 130.0 149.7 151.1 159.8 161.9 162.4 160.5 204.4 211.5 227.4 230.9 238.2 244.7 246.8 249.9 Accumulated Depreciation (73.8) (75.5) (75.1) (78.71 (81.4) 183.91 (84.9) (87.3) (90.5) [102.9) 108.4] (114.4] 119.6) [123.0) [128.3) Net Property. Plant & Equipment 56.2 74.2 76.0 81.1 80.5 78.5 75.6 117.1 120.9 118.7 116.7 124.5 122.5 123.9 125.2 123.8 121.6 Long-term Investments 12.5 13.2 14.2 13.4 10.2 10.7 17.0 16.2 15.0 18.0 14.7 15.3 13.5 13.0 12.4 10.8 9.8 38 Goodwill 16.4 16.4 16.4 16.4 16.4 16.4 27.1 37.0 33.1 33.1 55.0 55.7 55 7 55.7 55.7 55.7 39 Other Intangibles 2.6 2.3 2.4 2.5 2.6 2.9 31.6 27.5 26.3 25.1 30.1 30.5 30.4 31.2 32.6 34.7 Accounts Receivable Long-Term - 5.9 5.6 5.3 5.0 4.7 4.8 4.6 3.7 3.4 41 Loans Receivable Long-Term 1.1 0.1 1.6 2.1 2.1 1.8 1.2 0.6 42 Deferred Tax Assets, LT 43 Other Long-Term Assets 44 Total Assets 45 46 LIABILITIES 47 Accounts Payable 48 Accrued Exp. 49 Short-term Borrowings 10.9 10.2 10.7 11.5 11.3 10.9 10.6 28.6 33.8 29.5 33.4 32.6 32.8 30.0 30.0 29.9 31.6 4.5 7.0 12.1 5.2 5.9 2.8 3.1 4.4 4.7 1.3 2.1 652 0 605 1 643.0 754 1 856 8 8216 794 6 1212 7 1,067 6 948 6. 985 3 1,157 6. 1 137 1 1,077 0 1102 0 1217 7 1229 3 50 Curr. Port. of LT Debt 51 Curr. Port. of Leases 52 Curr. Income Taxes Payable 53 Unearned Revenue, Current 54 Other Current Liabilities 55 Total Current Liabilities 57 Long-Term Debt 58 Long-Term Leases 59 Pension & Other Post-Retire. Benefits 60 Def. Tax Liability, Non-Curr. 61 Other Non-Current Liabilities 62 Total Liabilities 64 Common Stock 65 Additional Paid In Capital 66 Retained Earnings Ready 383.6 300.5 309.6 356.6 419.9 3682 332.0 517.8 490.5 405.8 435.8 522.0 514.3 488.2 477.1 566.9 573.2 0.9 12 2.0 2.1 1.8 1.3 0.9 1.5 1.8 5.3 6.2 8.2 10.6 58 5.3 4.3 8.2 11.8 16.9 28.2 56.3 85.4 105.3 125.2 130.4 2.2 5.1 6.0 6.0 5.9 22.1 5.0 8.1 8.1 8.0 8.0 7.4 7.5 7.1 27.1 27.0 7.1 3.1 6.2 7.1 7.6 8.0 8.2 18.3 18.7 16.8 17.9 18.3 19.8 16.6 17.1 17.0 17.8 3.4 4.4 6.2 7.1 6.2 17 5.1 19.8 20.2 10.4 8.5 8.0 8.7 8.1 8.0 10.8 60.0 75.0 90.0 117.2 112.1 96.7 101.6 143.9 121.5 115.6 102.5 136.5 130.3 120.7 138.5 147.0 11.3 12.1 11.7 105 9.6 16.7 21.7 29.5 30.2 36.2 30.7 22.3 21.4 25.6 21.6 476.3 421.5 460.6 563.2 648.9 620.4 592.6 861.5 690.2 582.3 611.0 737.1 721.3 669.6 681.5 787.2 785.7 19.1 26.4 27.8 26.2 348 33.3 32.9 65.2 64.9 572 555 78.3 71.2 69.2 67.7 69.7 68.0 5.7 21.4 20.3 24.0 23.1 21.7 20.2 55 1 59.3 60.2 57.8 59.6 62.0 60.2 57.7 55.5 5.0 03 0.1 04 0.2 7.4 5.0 6.3 9.6 13.9 12.3 14.3 18.2 23.1 18.9 21.6 22.9 24.8 18.1 26.7 28.9 35.8 7.3 7.3 6.9 7.4 8.5 9.4 8.5 11.7 12.7 17.2 13.1 12.3 11.3 515.8 481.4 521.9 630.4 729.1 697.0 668.5 1,016.7 854.9 731.7 759.6 919.0 893.7 832.0 848.4 954.7 956.3 42.5 42.5 42.5 42.5 42.5 42.5 42.5 108.1 108.1 108. 108.1 114.6 114.6 114.6 114.6 114.6 114.6 2.0 2.0 2.0 2.0 2.0 2.0 2.0 2.0 2.0 2.0 2.0 2.0 2.0 2.0 2.0 2.0 91.7 79.2 76.5 79.2 83.2 80.2 81.7 86.0 102.5 115.5 122.1 126.9 128.4 137.1 146.6 156.5 Key Stats Income Statement Balance Sheet Cash Flow Multiples Historical + Accessibility: Investigate m + 57%
Step by Step Solution
There are 3 Steps involved in it

Get step-by-step solutions from verified subject matter experts