

Question: Ratios Average collection period Total assets turnover Inventory turnover Quick ratio Alhekma Competitors 33.5 days 27.9 days 2.3 3.7 1.8 2.8 0.6 1.3 Cash
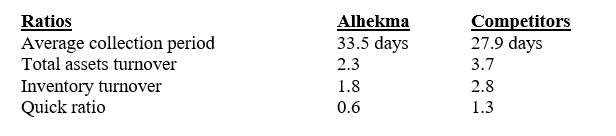
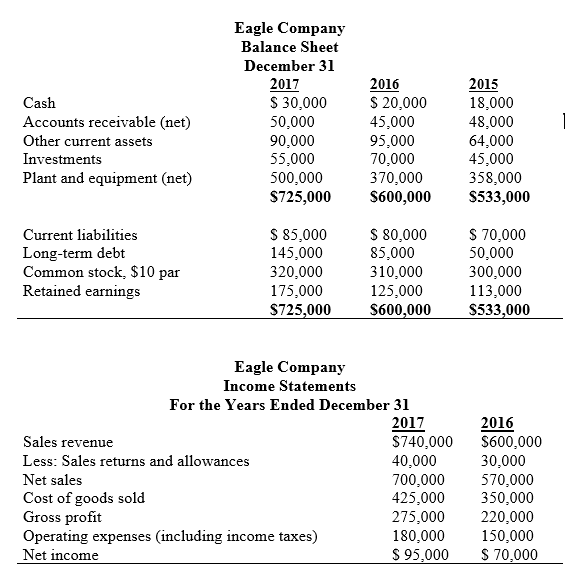
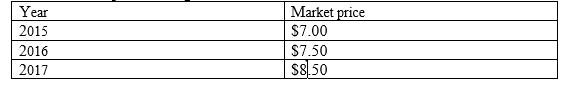
Ratios Average collection period Total assets turnover Inventory turnover Quick ratio Alhekma Competitors 33.5 days 27.9 days 2.3 3.7 1.8 2.8 0.6 1.3 Cash Accounts receivable (net) Other current assets Investments Plant and equipment (net) Current liabilities Long-term debt Common stock, $10 par Retained earnings Eagle Company Balance Sheet December 31 2017 2016 2015 $ 30,000 $ 20,000 18,000 50,000 45,000 48,000 90,000 95,000 64,000 55,000 70,000 45,000 500,000 370,000 $725,000 $600,000 358,000 $533,000 $ 85,000 $ 80,000 145,000 85,000 $ 70,000 50,000 320,000 310,000 300,000 175,000 125,000 113,000 $725,000 $600,000 $533,000 Eagle Company Income Statements For the Years Ended December 31 Sales revenue Less: Sales returns and allowances Net sales Cost of goods sold Gross profit Operating expenses (including income taxes) Net income 2017 2016 $740,000 $600,000 40,000 30,000 700,000 570,000 425,000 350,000 275,000 220,000 180,000 150,000 $ 95,000 $ 70,000 Year Market price 2015 $7.00 2016 $7.50 2017 $8.50
Step by Step Solution
There are 3 Steps involved in it

Get step-by-step solutions from verified subject matter experts