

Question: Raw data from Excel for American Airlines (AAL) and Exxon Mobile (XOM): Date AAL XOM Returns for AAL Returns for XOM Mar-13 16.38 76.44 Apr-13
Raw data from Excel for American Airlines (AAL) and Exxon Mobile (XOM):
| Date | AAL | XOM | Returns for AAL | Returns for XOM | ||
| Mar-13 | 16.38 | 76.44 | ||||
| Apr-13 | 16.32 | 75.49 | e.g., | -0.00412479 | -0.012429557 | |
| May-13 | 16.96 | 76.75 | ||||
| Jun-13 | 15.85 | 77.18 | ||||
| Jul-13 | 18.68 | 80.08 | ||||
| Aug-13 | 15.60 | 74.45 | ||||
| Sep-13 | 18.30 | 74.00 | ||||
| Oct-13 | 21.21 | 77.08 | ||||
| Nov-13 | 22.67 | 80.40 | ||||
| Dec-13 | 24.38 | 87.63 | ||||
| Jan-14 | 32.39 | 79.81 | ||||
| Feb-14 | 35.65 | 83.36 | ||||
| Mar-14 | 35.33 | 85.18 | ||||
| Apr-14 | 33.86 | 89.31 | ||||
| May-14 | 38.77 | 87.67 | ||||
| Jun-14 | 41.47 | 88.40 | ||||
| Jul-14 | 37.51 | 86.87 | ||||
| Aug-14 | 37.63 | 87.33 | ||||
| Sep-14 | 34.34 | 83.15 | ||||
| Oct-14 | 40.02 | 85.50 | ||||
| Nov-14 | 47.09 | 80.05 | ||||
| Dec-14 | 52.04 | 82.33 | ||||
| Jan-15 | 47.62 | 77.85 | ||||
| Feb-15 | 46.48 | 78.84 | ||||
| Mar-15 | 51.31 | 76.26 | ||||
| Apr-15 | 46.95 | 78.39 | ||||
| May-15 | 41.28 | 76.44 | ||||
| Jun-15 | 38.91 | 75.26 | ||||
| Jul-15 | 39.07 | 71.66 | ||||
| Aug-15 | 37.98 | 68.06 | ||||
| Sep-15 | 37.92 | 67.89 | ||||
| Oct-15 | 45.13 | 75.55 | ||||
| Nov-15 | 40.29 | 74.56 | ||||
| Dec-15 | 41.44 | 71.80 | ||||
| Jan-16 | 38.16 | 71.70 | ||||
| Feb-16 | 40.12 | 73.82 | ||||
| Mar-16 | 40.24 | 77.69 | ||||
| Apr-16 | 34.04 | 82.16 | ||||
| May-16 | 31.31 | 82.74 | ||||
| Jun-16 | 27.86 | 87.85 | ||||
| Jul-16 | 34.94 | 83.37 | ||||
| Aug-16 | 35.72 | 81.67 | ||||
| Sep-16 | 36.14 | 82.50 | ||||
| Oct-16 | 40.07 | 78.75 | ||||
| Nov-16 | 45.84 | 82.52 | ||||
| Dec-16 | 46.20 | 86.07 | ||||
| Jan-17 | 43.79 | 80.00 | ||||
| Feb-17 | 45.88 | 77.54 | ||||
| Mar-17 | 41.95 | 78.92 | ||||
| Apr-17 | 42.27 | 78.57 | ||||
| May-17 | 48.01 | 77.46 | ||||
| Jun-17 | 50.01 | 78.42 | ||||
| Jul-17 | 50.13 | 77.75 | ||||
| Aug-17 | 44.47 | 74.15 | ||||
| Sep-17 | 47.30 | 80.41 | ||||
| Oct-17 | 46.63 | 81.75 | ||||
| Nov-17 | 50.28 | 81.69 | ||||
| Dec-17 | 51.93 | 82.79 | ||||
| Jan-18 | 54.22 | 86.42 | ||||
| Feb-18 | 54.15 | 74.97 | ||||
| Mar-18 | 54.11 | 74.26 | ||||
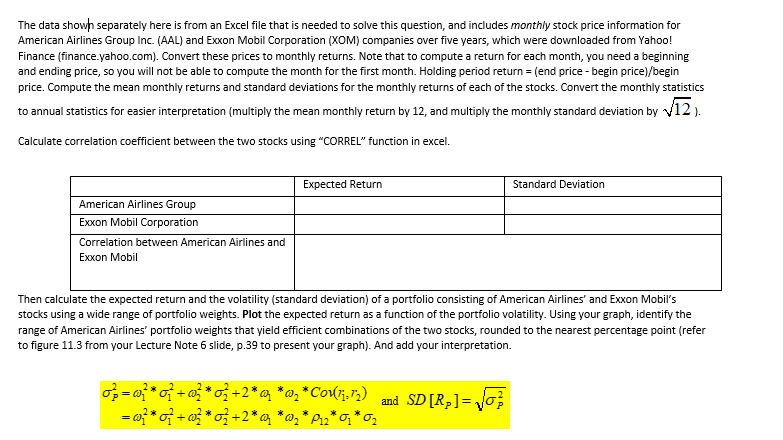
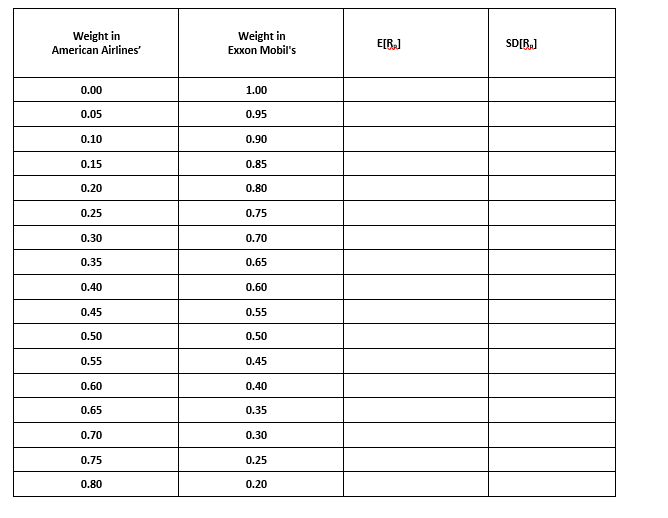
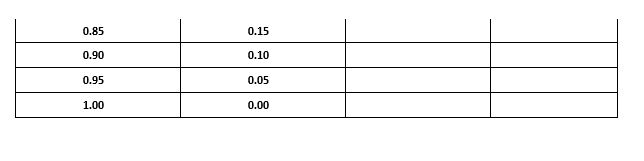
The data showh separately here is from an Excel file that is needed to solve this question, and includes monthly stock price information for American Airlines Group Inc. (AAL) and Exxon Mobil Corporation (XOM) companies over five years, which were downloaded from Yahoo! Finance (finance.yahoo.com). Convert these prices to monthly returns. Note that to compute a return for each month, you need a beginning and ending price, so you will not be able to compute the month for the first month. Holding period return (end price - begin price)/begin price. Compute the mean monthly returns and standard deviations for the monthly returns of each of the stocks. Convert the monthly statistics to annual statistics for easier interpretation (multiply the mean monthly return by 12, and multiply the monthly standard deviation by V12). Calculate correlation coefficient between the two stocks using "CORREL" function in excel. Expected Return Standard Deviation American Airlines Group Exxon Mobil Corporation Correlation between American Airlines and Exxon Mobil Then calculate the expected return and the volatility (standard deviation) of a portfolio consisting of American Airlines' and Exxon Mobil's stocks using a wide range of portfolio weights. Plot the expected return as a function of the portfolio volatility. Using your graph, identify the range of American Airlines portfolio weights that yield efficient combinations of the two stocks, rounded to the nearest percentage point (refer to figure 11.3 from your Lecture Note 6 slide, p.39 to present your graph). And add your interpretation
Step by Step Solution
There are 3 Steps involved in it

Get step-by-step solutions from verified subject matter experts