

Question: # Raw data Using R ## Description Compiled by J. Monroe Gamble for a Summer Research Opportunities Program (SROP) at Michigan State University, Summer 2014.
# Raw data
Using R
## Description
Compiled by J. Monroe Gamble for a Summer Research Opportunities Program (SROP) at Michigan State University, Summer 2014. Monroe obtained data from the U.S. Census Bureau, the FBI Uniform Crime Reports, and the Death Penalty Information Center.
https://www.dropbox.com/s/q99hntyrisud6n6/murders.csv?dl=0
## Format
A data.frame with 37349 observations on 20 variables:
- arrests: # of murder arrests - countyid: county identifier: 1000*statefips + countyfips - density: population density; per square mile - popul: county population - perc1019: percent pop. age 10-19 - perc2029: percent pop. age 20-29 - percblack: percent population black - percmale: percent population male - rpcincmaint: real per capita income maintenance - rpcpersinc: real per capita personal income - rpcunemins: real per capita unem insurance payments - year: 1980-1996 - murders: # of murders - murdrate: murders per 10,000 people - arrestrate: murder arrests per 10,000 - statefips: state FIPS code - countyfips: county FIPS code - execs: # of executions - lpopul: log(popul) - execrate: executions per 10,000
Question 1:
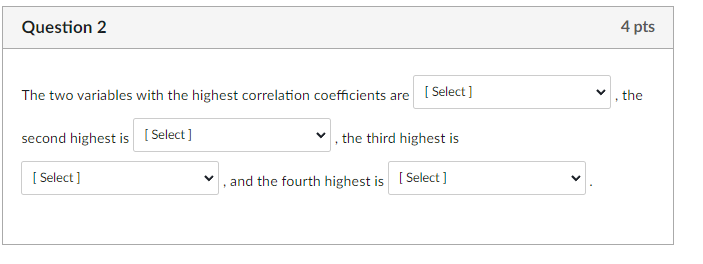
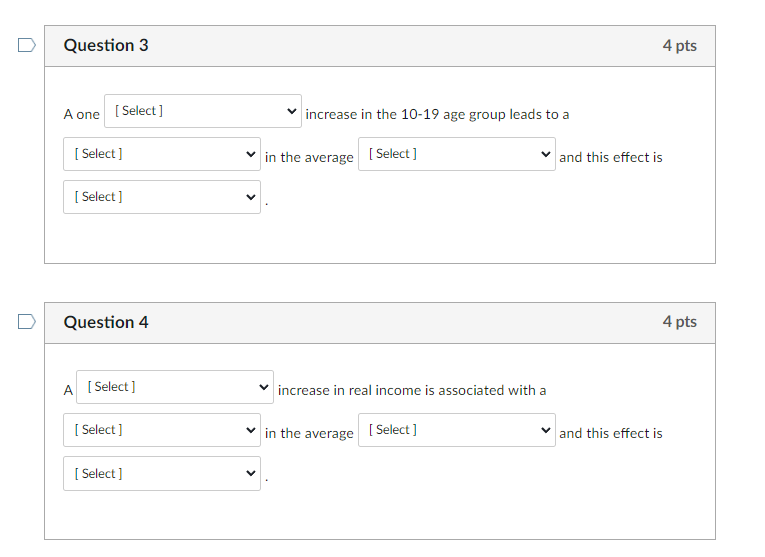
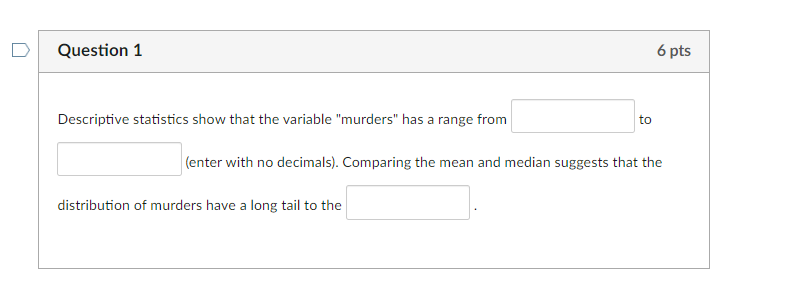
Question 2 4 pts The two variables with the highest correlation coefficients are [ Select ] , the second highest is [ Select ] the third highest is [ Select ] V , and the fourth highest is |[ Select ]D Question 3 4 pts A one [ Select ] increase in the 10-19 age group leads to a [ Select ] in the average [ Select ] and this effect is [ Select ] D Question 4 4 pts A [ Select ] increase in real income is associated with a [ Select ] in the average [ Select ] and this effect is [ Select ]D Question 1 6 pts Descriptive statistics show that the variable "murders" has a range from to (enter with no decimals). Comparing the mean and median suggests that the distribution of murders have a long tail to the
Step by Step Solution
There are 3 Steps involved in it

Get step-by-step solutions from verified subject matter experts