

Question: Raw materials inventory turnover How is this ratio calculated? What does the ratio show? Using the data on the Sunn Corporation from page 19 of
Raw materials inventory turnover
- How is this ratio calculated?
- What does the ratio show?
- Using the data on the Sunn Corporation from page 19 of the textbook, calculate and discuss the implications of Sunn's RM Inventory Turnover. Your response should show how you calculated the value.
Days' sales in raw materials inventory
- How is this ratio calculated?
- What does the ratio show?
- Using the data on the Sunn Corporation from page 19 of the textbook, calculate and discuss the implications of Sunn's Days' Sales in RM Inventory
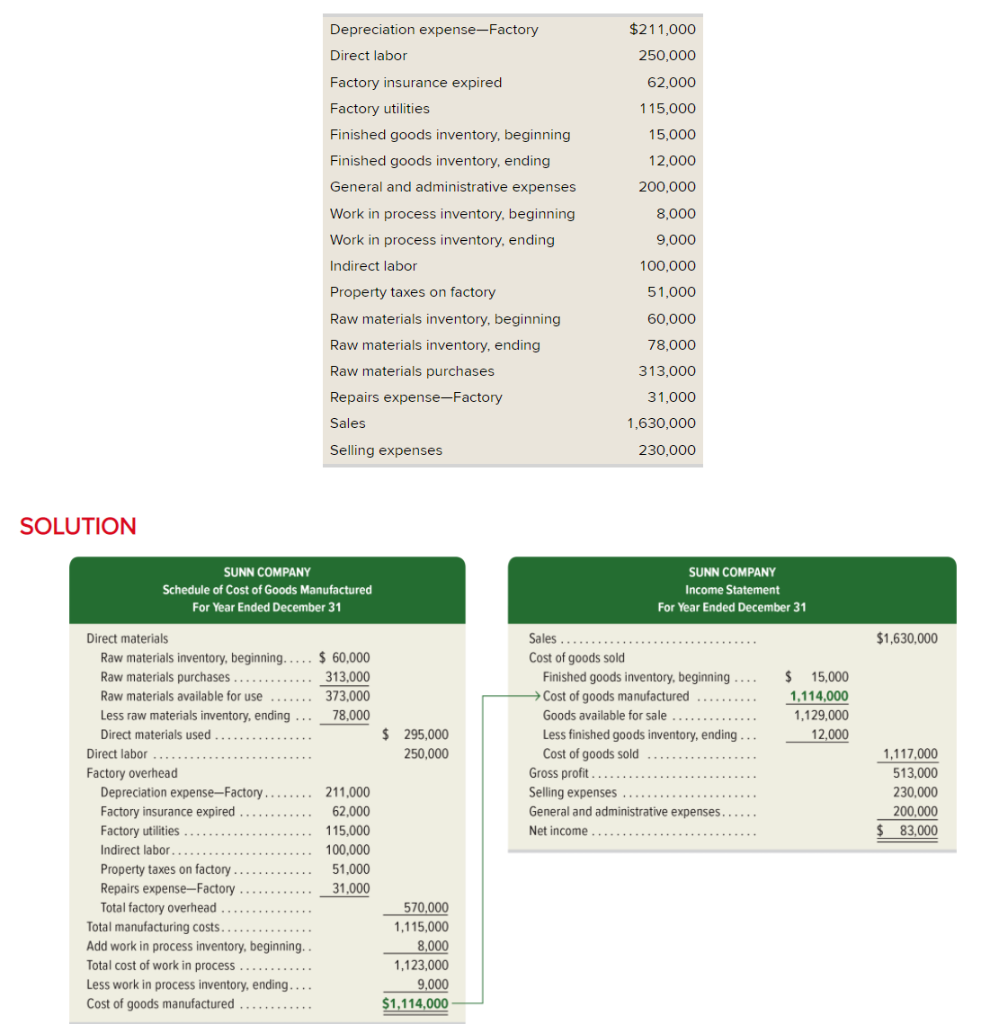
Depreciation expense-Factory $211,000 250,000 Direct labor 62,000 115,000 15,000 12,000 200,000 8,000 9,000 Factory insurance expired Factory utilities Finished goods inventory, beginning Finished goods inventory, ending General and administrative expenses Work in process inventory, beginning Work in process inventory, ending Indirect labor Property taxes on factory Raw materials inventory, beginning Raw materials inventory, ending Raw materials purchases Repairs expense-Factory Sales 100.000 51,000 60,000 78,000 313,000 31,000 1,630,000 Selling expenses 230,000 SOLUTION SUNN COMPANY Schedule of Cost of Goods Manufactured For Year Ended December 31 SUNN COMPANY Income Statement For Year Ended December 31 $1,630,000 $ 15,000 1,114,000 1,129,000 12,000 $ 295,000 250.000 Direct materials Raw materials inventory, beginning..... $ 60,000 Raw materials purchases 313,000 Raw materials available for use 373.000 Less raw materials inventory, ending ... 78,000 Direct materials used Direct labor Factory overhead Depreciation expense-Factory. 211,000 Factory insurance expired 62,000 Factory utilities 115,000 Indirect labor 100.000 Property taxes on factory 51,000 Repairs expense-Factory 31,000 Total factory overhead Total manufacturing costs. Add work in process inventory, beginning. Total cost of work in process Less work in process inventory, ending.... Cost of goods manufactured Sales Cost of goods sold Finished goods inventory, beginning .... Cost of goods manufactured Goods available for sale Less finished goods inventory, ending ... Cost of goods sold Gross profit Selling expenses. General and administrative expenses. Net income 1,117,000 513,000 230.000 200.000 $ 83,000 570,000 1,115,000 8,000 1,123,000 9,000 $1,114,000
Step by Step Solution
There are 3 Steps involved in it

Get step-by-step solutions from verified subject matter experts