

Question: re certain.) Using your graph, label and note the equilibrium rate of interest using the current data. Add to the graph drawn in part a
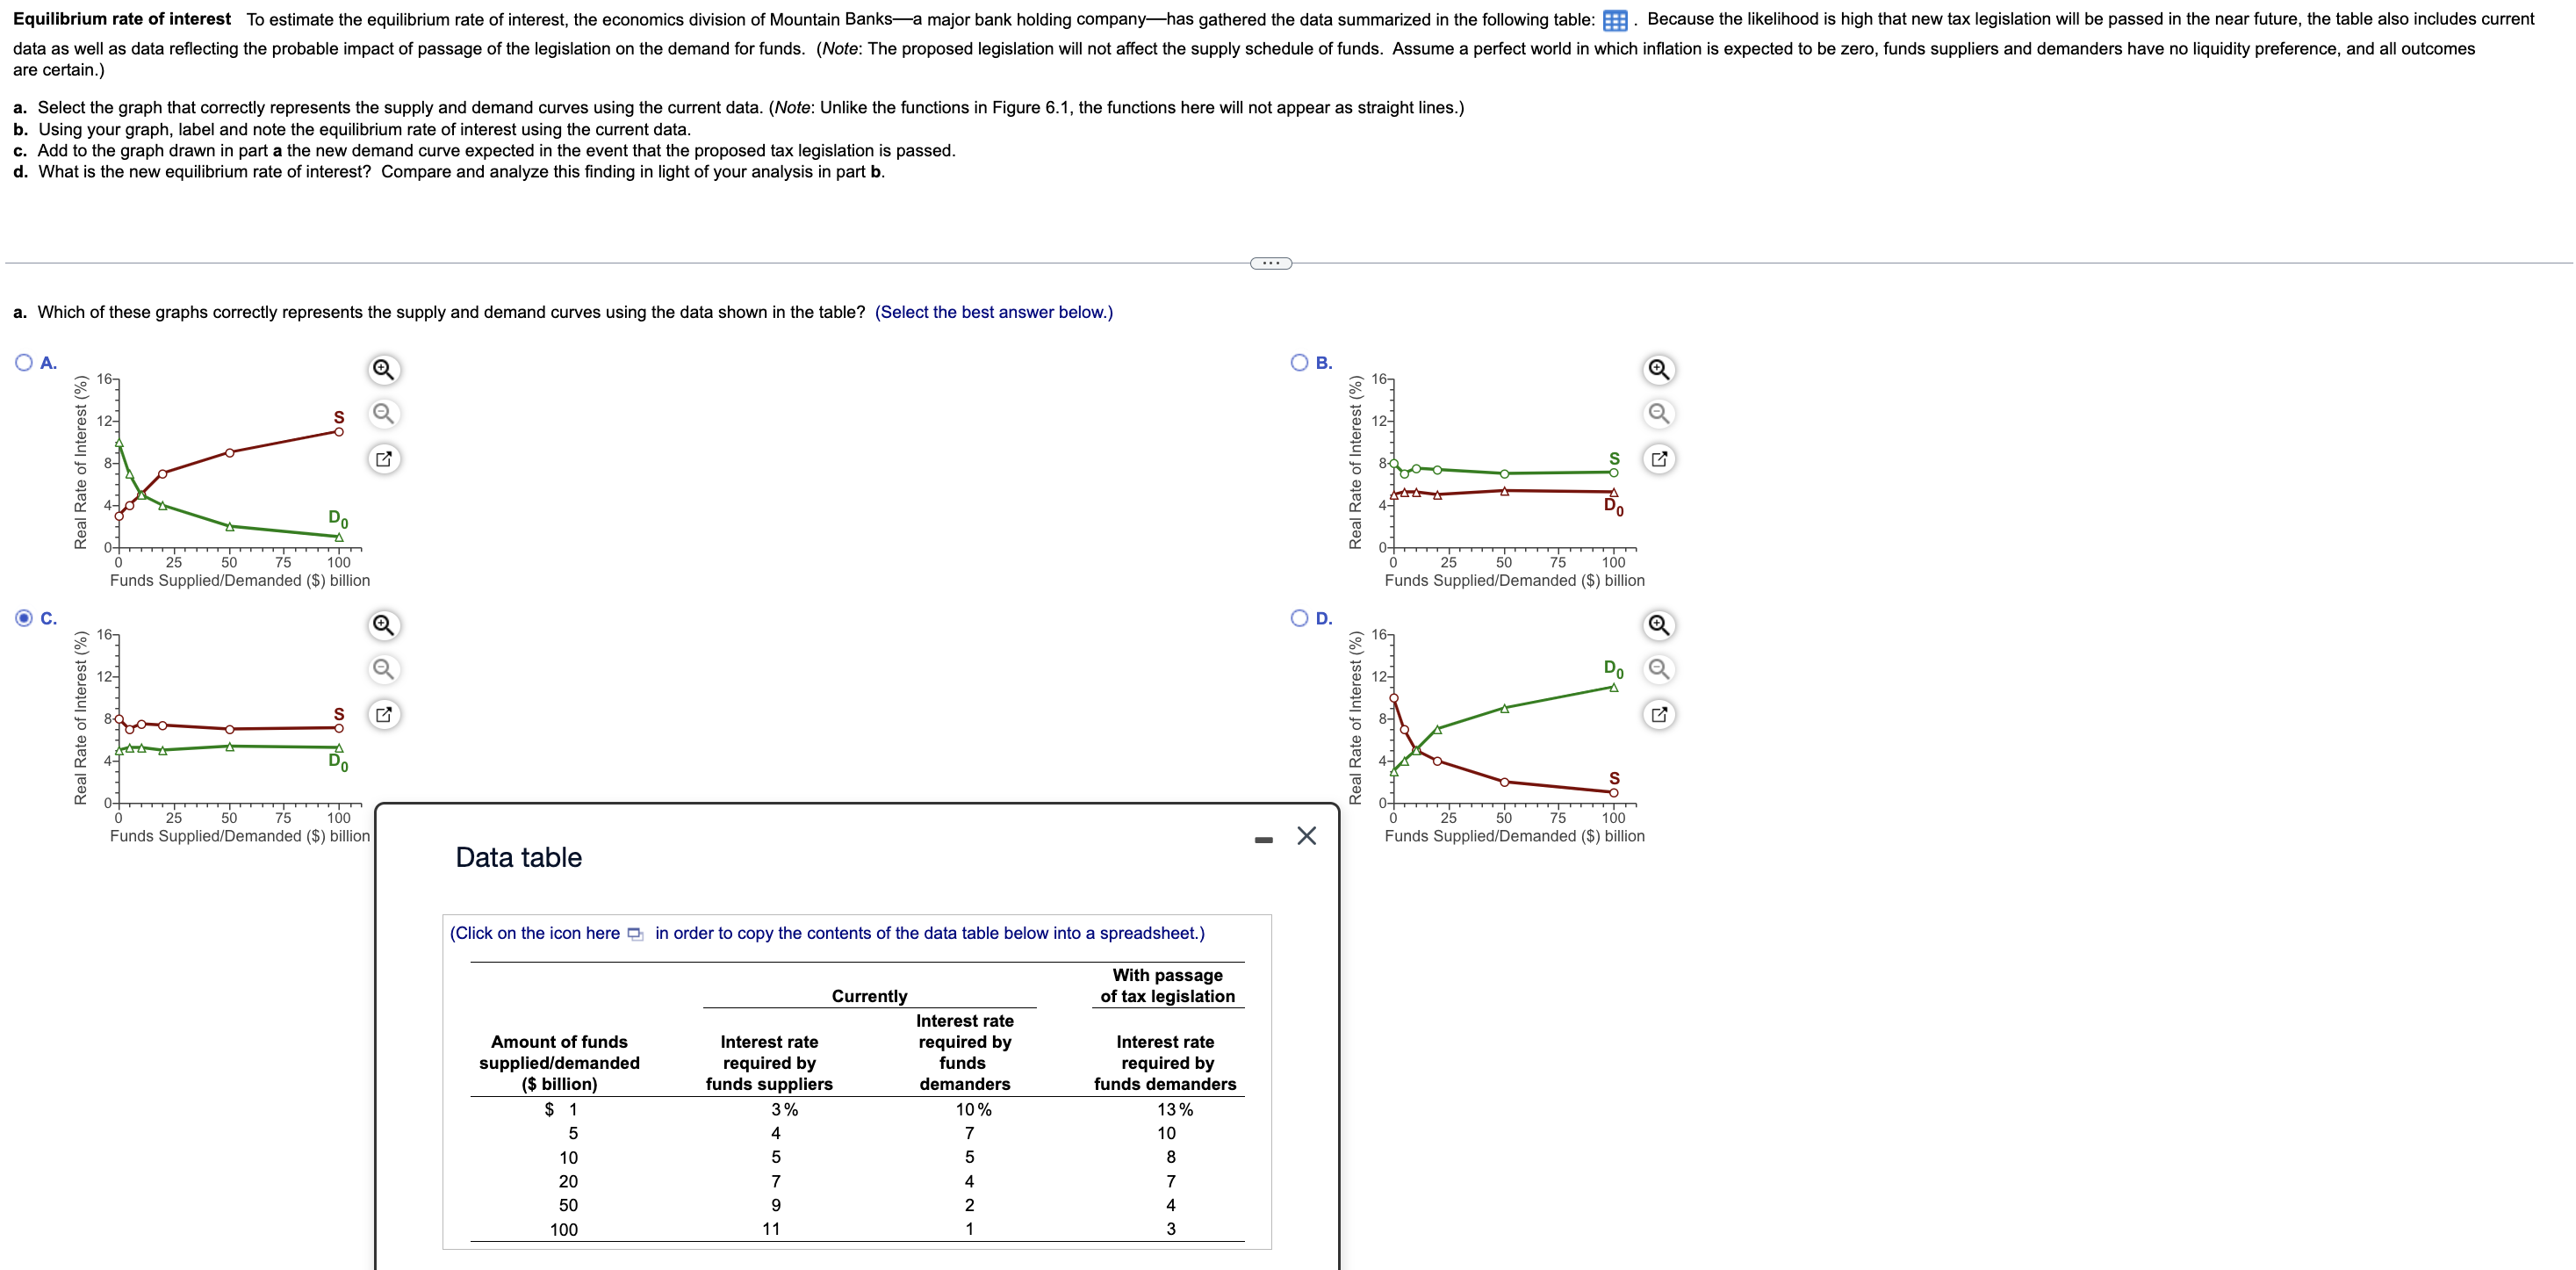
re certain.) Using your graph, label and note the equilibrium rate of interest using the current data. Add to the graph drawn in part a the new demand curve expected in the event that the proposed tax legislation is passed. What is the new equilibrium rate of interest? Compare and analyze this finding in light of your analysis in part b. Which of these graphs correctly represents the supply and demand curves using the data shown in the table? (Select the best answer below.) O! Q D. Data table x (Click on the icon here in order to copy the contents of the data table below into a spreadsheet.) re certain.) Using your graph, label and note the equilibrium rate of interest using the current data. Add to the graph drawn in part a the new demand curve expected in the event that the proposed tax legislation is passed. What is the new equilibrium rate of interest? Compare and analyze this finding in light of your analysis in part b. Which of these graphs correctly represents the supply and demand curves using the data shown in the table? (Select the best answer below.) O! Q D. Data table x (Click on the icon here in order to copy the contents of the data table below into a spreadsheet.)
Step by Step Solution
There are 3 Steps involved in it

Get step-by-step solutions from verified subject matter experts