

Question: Read aloud Ask Copilot 3 of 4 - Create a table using Medium Style 2 , providing three pros and three cons relating to the
Read aloud
Ask Copilot
of
Create a table using Medium Style providing three pros and three cons relating to the Data Analyst career.
Sllde
marks
As a data analyst, you must present findings from a recent marketing campalgn. You decide to create a chart in PowerPoint for a more precise presentation.
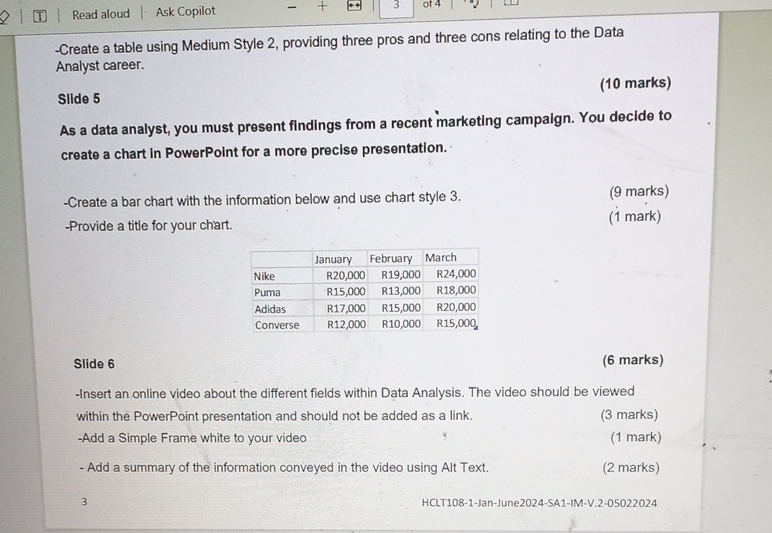
Create a bar chart with the information below and use chart style
marks
Provide a title for your chart.
mark
tableJanuary,February,MarchNikeRRRPumaRRRAdidasRRRConverseRRR
Slide
marks
Insert an online video about the different fields within Data Analysis. The video should be viewed within the PowerPoint presentation and should not be added as a link.
marks
Add a Simple Frame white to your video
mark
Add a summary of the information conveyed in the video using Alt Text.
marks
HCLTJanJuneSAIMV
Step by Step Solution
There are 3 Steps involved in it
1 Expert Approved Answer
Step: 1 Unlock

Question Has Been Solved by an Expert!
Get step-by-step solutions from verified subject matter experts
Step: 2 Unlock
Step: 3 Unlock