

Question: Read below and identify which measures you would recommend to the CEO of game products. Explain the reasoning behind your recommendation. Note: Response must be
Read below and identify which measures you would recommend to the CEO of game products. Explain the reasoning behind your recommendation.
Note: Response must be at least 2 paragraphs of at least 5 sentences per paragraph. please include work cited and references with links.
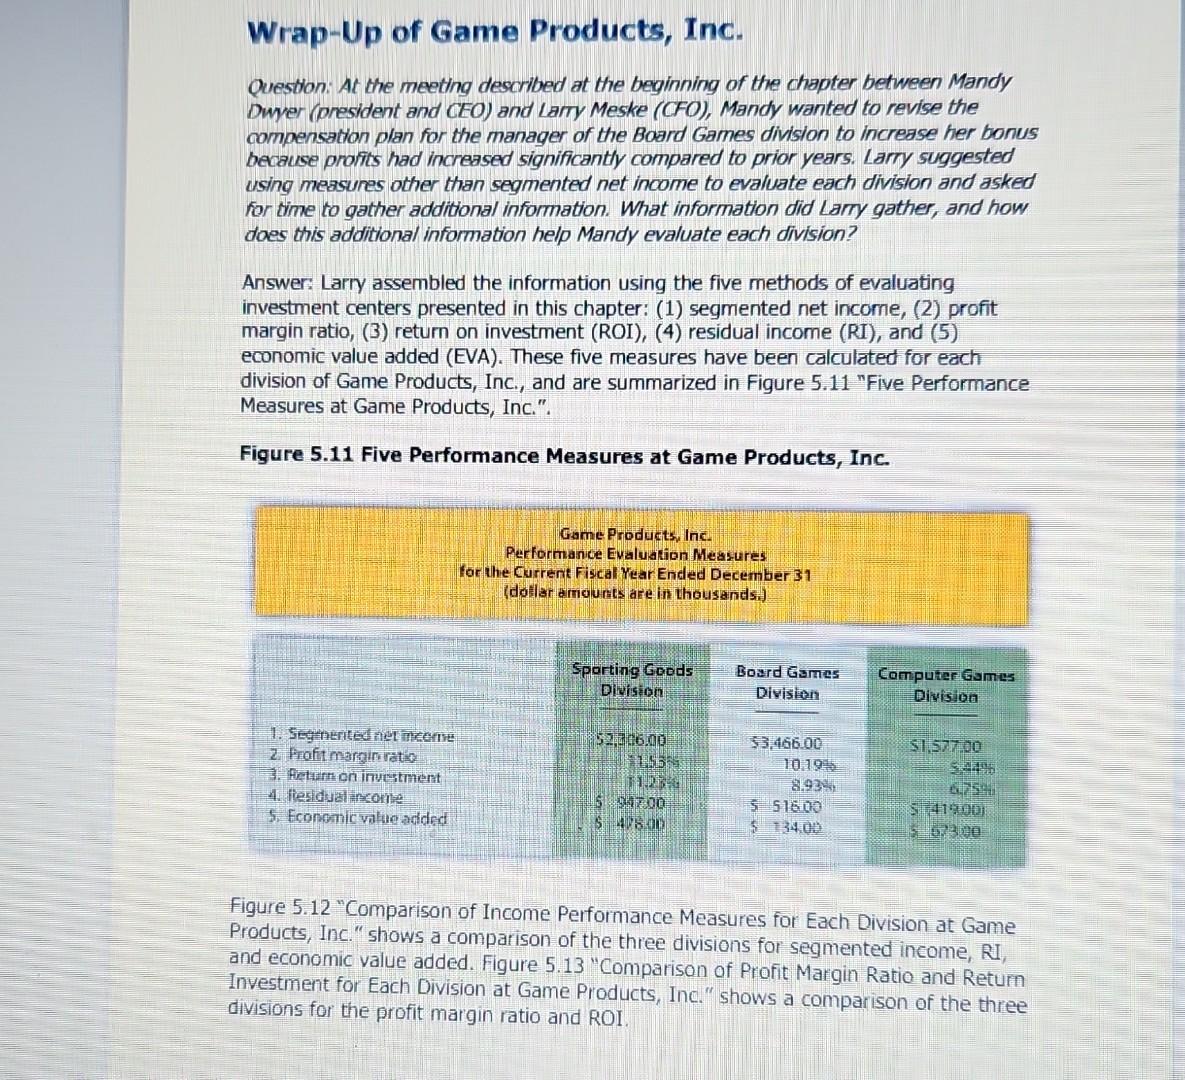
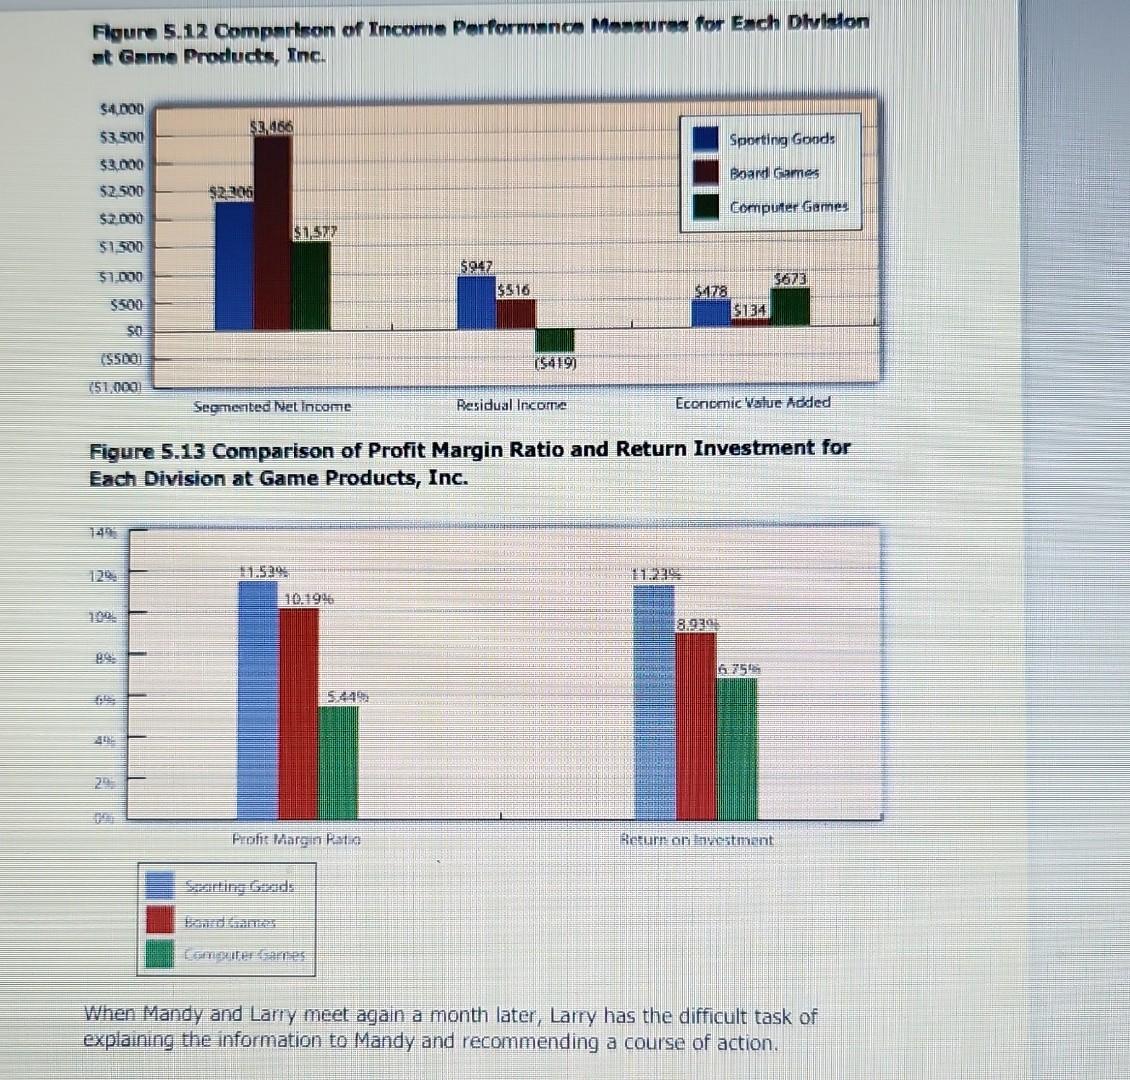
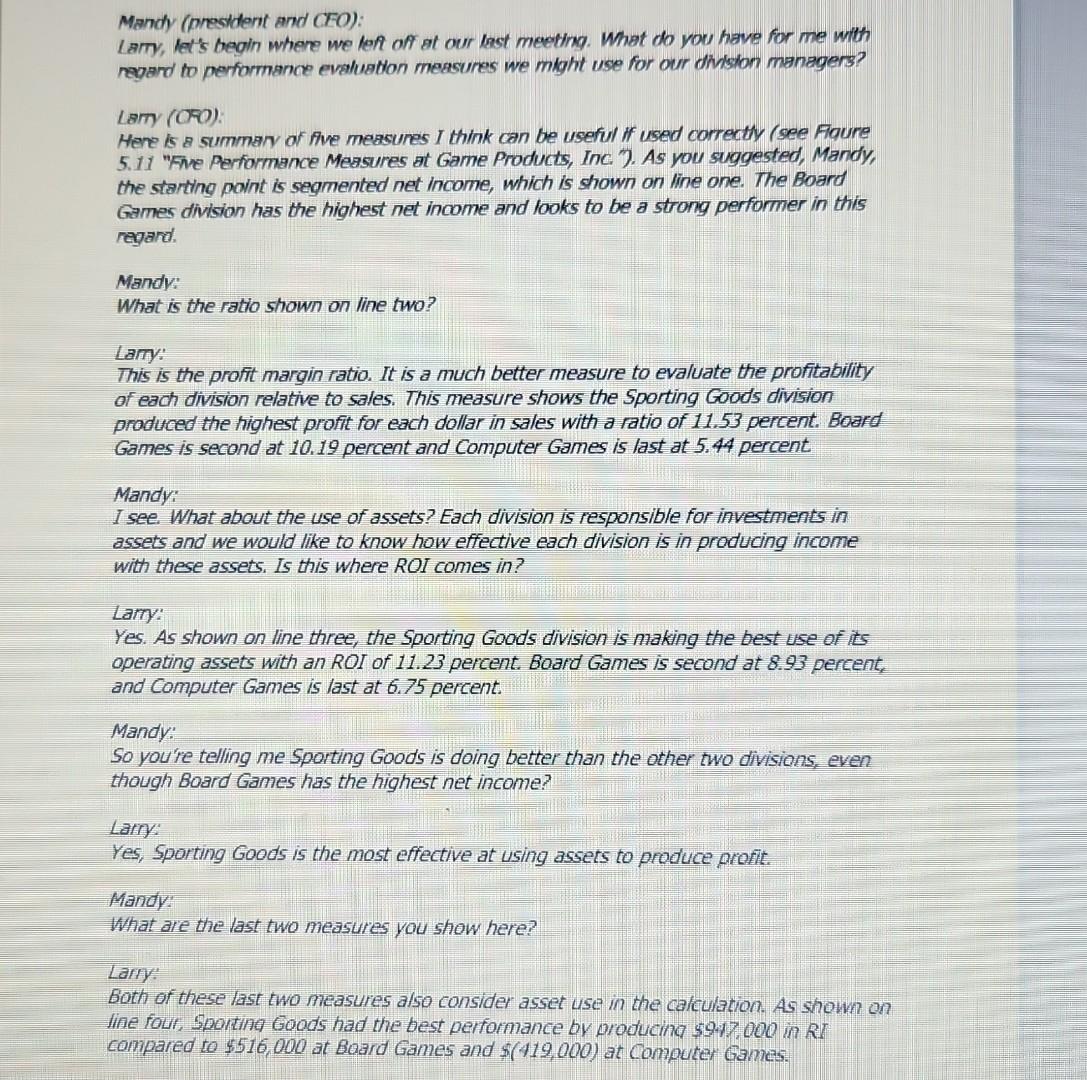
Wrap-Up of Game Products, Inc. Question: At the meeting described at the beginning of the chapter between Mandy Dwyer (president and CEO) and Larry Meske (CFO), Mandy wanted to revise the compensation plan for the manager of the Board Games division to increase her bonus because profits had increased significantly compared to prior years. Larry suggested using measures other than segmented net income to evaluate each division and asked for time to gather additional information. What information did Larry gather, and how does this additional information help Mandy evaluate each division? Answer: Larry assembled the information using the five methods of evaluating investment centers presented in this chapter: (1) segmented net income, (2) profit margin ratio, (3) return on investment (ROI), (4) residual income (RI), and (5) economic value added (EVA). These five measures have been calculated for each division of Game Products, Inc., and are summarized in Figure 5.11 "Five Performance Measures at Game Products, Inc.". Figure 5.11 Five Performance Measures at Game Products, Inc. Figure 5.12 "Comparison of Income Performance Measures for Each Division at Game Products, Inc." shows a comparison of the three divisions for segmented income, RI and economic value added. Figure 5.13 "Comparison of Profit Margin Ratio and Return Investment for Each Division at Game Products, Inc." shows a comparison of the three divisions for the profit margin ratio and ROI. Floure 5.12 Comperison of Income Performence Mensures for Exch Dlyiston it Game Producis, Ine. Figure 5.13 Comparison of Profit Margin Ratio and Return Investment for Each Division at Game Products, Inc. When Mandy and Larry meet again a month later, Larry has the difficult task of explaining the information to Mandy and recommending a course of action. Mandy (prestdent and CFO): Lamy, let's begin where we left off at our bast meeting. What do you have for me with ragard to performance evaluabon measures we might use for our dhishon managers? LAmy (OA). Here is a summary of five measures I think can be useful if used correctly (see fqure 5.11 "Five Performance Measures at Game Products, Inc. 7. As you suggested, Mandy, the starting point is segmented net income, which is shown on line one. The Board Games division has the highest net income and looks to be a strong performer in this regard. Mandy: What is the ratio shown on line two? Lamy: This is the profit margin ratio. It is a much better measure to evaluate the profitability of each division relative to sales. This measure shows the Sporting Goods division produced the highest profit for each dollar in sales with a ratio of 11.53 percent. Board Games is second at 10.19 percent and Computer Games is last at 5.44 percent Mandy: I see. What about the use of assets? Each division is responsible for investments in assets and we would like to know how effective each division is in producing income with these assets. Is this where ROI comes in? Lamy: Yes. As shown on line three, the Sporting Goods division is making the best use of its operating assets with an ROI of 11.23 percent. Board Games is second at 8.93 percent. and Computer Games is last at 6.75 percent. Mandy: So vou're telling me Sporting Goods is doing better than the other two divisions, even though Board Games has the highest net income? Larry: Yes, sporting Goods is the most effective at using assets to produce profit: Mandy. What are the last two measures you show here? Lafly: Both of these last two measures also consider asset use in the cattulation. As show on line fout, Sportina Goods had the best performance by producina 5947,000 in RI compared to $516,000 at Board Games and $(419,000) at Computer Games Mandy: Computer Games has negathe RI? Lamy: Yes. However, you will notice that EVA shown on line five presents a different picture. Mandy: Why? Lamy: Computer Games has high research and development costs each year-it's the nature of the industry. U.S. GAAP requires these costs to be expensed when incurred. EVA suggests recording R\&D costs as an asset and amortizing the costs over the useful life of R\&D activities. Since Computer Games has much higher R\&D costs than the other divisions, the numbers changed dramatically relative to the other divisions. Also, aftertax income is used rather than operating income, and average assets are adjusted as well. Mandy: Seems as if there is an awful lot of subjectivity in using EVA. LaTty: Yes, there is. If we choose to use EVA as one of our measures, management must meet to discuss and agree upon the adjustments to be made. Mandy: Larry, thanks for your analysis. I'm beginning to understand the importance of including asset use in our performance measures. Where do we go from here? Lamy: I like the first three measures-net income, profit margin ratio, and ROI. They are widely used in industry, and managers tend to understand the nature of these measures. The last two measures are also useful and should not be overiooked. My recommendation is to meet with the division managers to develop a comprehensive incentive compensation plan. The key is to develop a plan that motivates our managers to achieve company goals. Mandy: I like the idea! Let's meet next week. Wrap-Up of Game Products, Inc. Question: At the meeting described at the beginning of the chapter between Mandy Dwyer (president and CEO) and Larry Meske (CFO), Mandy wanted to revise the compensation plan for the manager of the Board Games division to increase her bonus because profits had increased significantly compared to prior years. Larry suggested using measures other than segmented net income to evaluate each division and asked for time to gather additional information. What information did Larry gather, and how does this additional information help Mandy evaluate each division? Answer: Larry assembled the information using the five methods of evaluating investment centers presented in this chapter: (1) segmented net income, (2) profit margin ratio, (3) return on investment (ROI), (4) residual income (RI), and (5) economic value added (EVA). These five measures have been calculated for each division of Game Products, Inc., and are summarized in Figure 5.11 "Five Performance Measures at Game Products, Inc.". Figure 5.11 Five Performance Measures at Game Products, Inc. Figure 5.12 "Comparison of Income Performance Measures for Each Division at Game Products, Inc." shows a comparison of the three divisions for segmented income, RI and economic value added. Figure 5.13 "Comparison of Profit Margin Ratio and Return Investment for Each Division at Game Products, Inc." shows a comparison of the three divisions for the profit margin ratio and ROI. Floure 5.12 Comperison of Income Performence Mensures for Exch Dlyiston it Game Producis, Ine. Figure 5.13 Comparison of Profit Margin Ratio and Return Investment for Each Division at Game Products, Inc. When Mandy and Larry meet again a month later, Larry has the difficult task of explaining the information to Mandy and recommending a course of action. Mandy (prestdent and CFO): Lamy, let's begin where we left off at our bast meeting. What do you have for me with ragard to performance evaluabon measures we might use for our dhishon managers? LAmy (OA). Here is a summary of five measures I think can be useful if used correctly (see fqure 5.11 "Five Performance Measures at Game Products, Inc. 7. As you suggested, Mandy, the starting point is segmented net income, which is shown on line one. The Board Games division has the highest net income and looks to be a strong performer in this regard. Mandy: What is the ratio shown on line two? Lamy: This is the profit margin ratio. It is a much better measure to evaluate the profitability of each division relative to sales. This measure shows the Sporting Goods division produced the highest profit for each dollar in sales with a ratio of 11.53 percent. Board Games is second at 10.19 percent and Computer Games is last at 5.44 percent Mandy: I see. What about the use of assets? Each division is responsible for investments in assets and we would like to know how effective each division is in producing income with these assets. Is this where ROI comes in? Lamy: Yes. As shown on line three, the Sporting Goods division is making the best use of its operating assets with an ROI of 11.23 percent. Board Games is second at 8.93 percent. and Computer Games is last at 6.75 percent. Mandy: So vou're telling me Sporting Goods is doing better than the other two divisions, even though Board Games has the highest net income? Larry: Yes, sporting Goods is the most effective at using assets to produce profit: Mandy. What are the last two measures you show here? Lafly: Both of these last two measures also consider asset use in the cattulation. As show on line fout, Sportina Goods had the best performance by producina 5947,000 in RI compared to $516,000 at Board Games and $(419,000) at Computer Games Mandy: Computer Games has negathe RI? Lamy: Yes. However, you will notice that EVA shown on line five presents a different picture. Mandy: Why? Lamy: Computer Games has high research and development costs each year-it's the nature of the industry. U.S. GAAP requires these costs to be expensed when incurred. EVA suggests recording R\&D costs as an asset and amortizing the costs over the useful life of R\&D activities. Since Computer Games has much higher R\&D costs than the other divisions, the numbers changed dramatically relative to the other divisions. Also, aftertax income is used rather than operating income, and average assets are adjusted as well. Mandy: Seems as if there is an awful lot of subjectivity in using EVA. LaTty: Yes, there is. If we choose to use EVA as one of our measures, management must meet to discuss and agree upon the adjustments to be made. Mandy: Larry, thanks for your analysis. I'm beginning to understand the importance of including asset use in our performance measures. Where do we go from here? Lamy: I like the first three measures-net income, profit margin ratio, and ROI. They are widely used in industry, and managers tend to understand the nature of these measures. The last two measures are also useful and should not be overiooked. My recommendation is to meet with the division managers to develop a comprehensive incentive compensation plan. The key is to develop a plan that motivates our managers to achieve company goals. Mandy: I like the idea! Let's meet next week
Step by Step Solution
There are 3 Steps involved in it

Get step-by-step solutions from verified subject matter experts