

Question: Read carefully the below instruction before you begin project 2. Consolidate all excel spreadsheets from partl in a single Excel file. Make a cover page
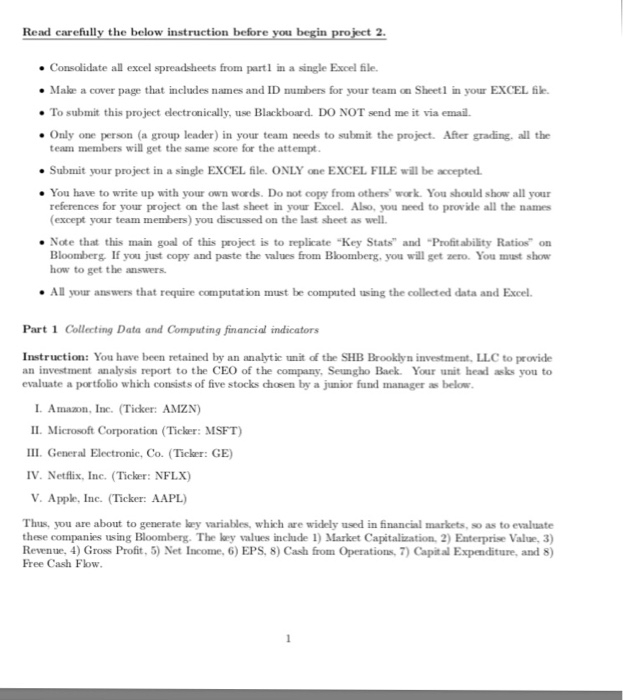
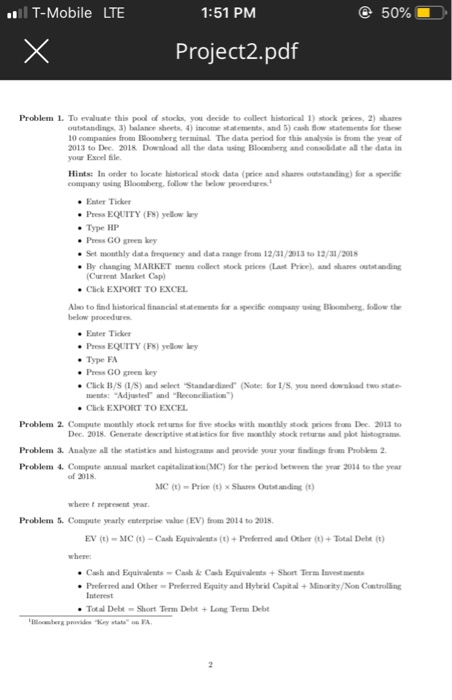
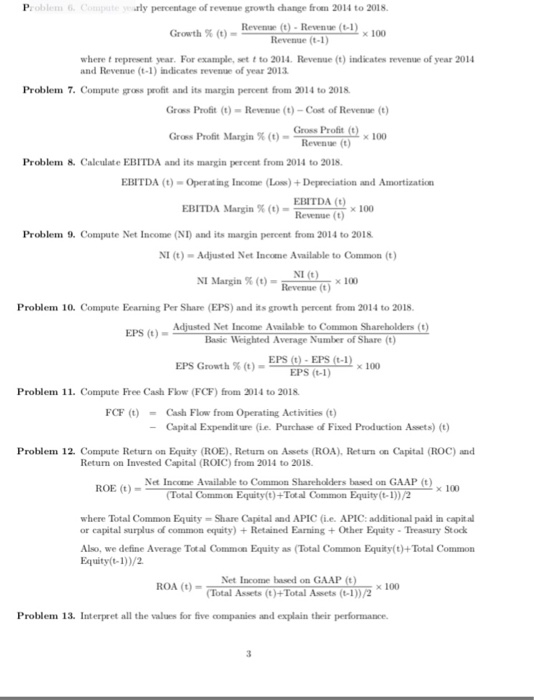
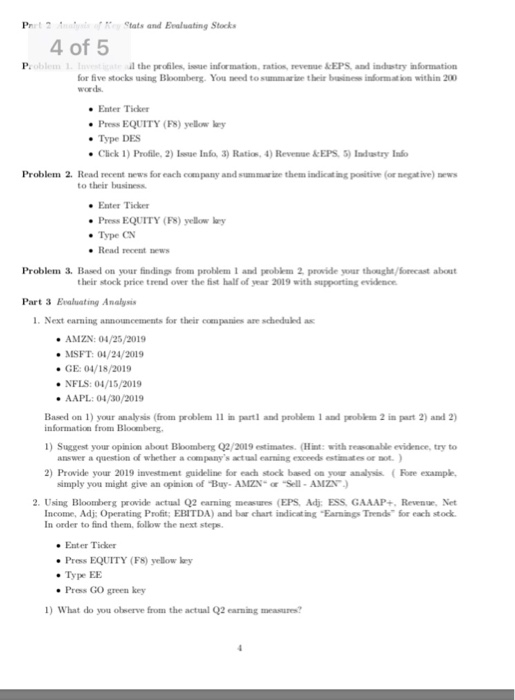

Read carefully the below instruction before you begin project 2. Consolidate all excel spreadsheets from partl in a single Excel file. Make a cover page that includes names and ID numbers for your team on Sheetl in your EXCEL file. To submit this project electronically, use Blackboard. DO NOT send me it via email. Only one person (a group leader) in your team needs to submit the project. After grading, all the team members will get the same score for the attempt. Submit your project in a single EXCEL file. ONLY one EXCEL FILE will be accepted. You have to write up with your own words. Do not copy from others' work. You should show all your references for your project on the last sheet in your Excel. Also, you need to provide all the names (except your team members) you discussed on the last sheet as well. Note that this main goal of this project is to replicate "Key Stats" and "Profitability Ratios" on Bloomberg. If you just copy and paste the values from Bloomberg, you will get zero. You must show how to get the answers. All your answers that require computation must be computed using the collected data and Excel Part 1 Collecting Data and Computing financial indicators Instruction: You have been retained by an analytic unit of the SHB Brooklyn investment, LLC to provide an investment analysis report to the CEO of the company, Seungho Back. Your unit head asks you to evaluate a portfolio which consists of five stocks chosen by a junior fund manager as below I. Amazon, Inc. (Ticker: AMZN) II. Microsoft Corporation (Ticker: MSFT) III. General Electronic, Co. (Ticker: GE) IV. Netflix, Inc. (Ticker: NFLX) V. Apple, Inc. (Ticker: AAPL) Thus, you are about to generate kry variables, which are widely used in financial markets, so as to evaluate these companies using Bloomberg. The ley values include 1) Market Capitalization. 2) Enterprise Value, 3) Revenue, 4) Gross Profit, 5) Net Income, 6) EPS, 8) Cash from Operations, 7) Capital Expenditure, and 8) Free Cash Flow. | T-Mobile LTE 1:51 PM @ 50% X Project2.pdf Problem 1. To evaluate this pod stock you decide to collect historical 1) ock p e 2) 10 companies from B e rger The data period for this 2013 to Dee 2018 Dwa w the data is the one of th Befoe the bedre Er Tiere Press EQUITY (F) yellow les Type HP Press GO greeney Set monthly data frequency and data range from 12/31/2013 to 12/31/2015 . By changing MARKET me collect stock prices Last Price and sha d ing Cut Market Cap) . Click EXPORT TO EXCEL Also to find historical financial statements for a specific company in Bloomberg, follow the below procedures Eater Tick . Press EQUITY (FS) yellow by Type FA Press GO green key . ClickB/S (1/S) and select Standardiand (Note: for I/S you need download two state . Click EXPORT TO EXCEL Problem 2. Compute monthly stock returns for five stocks with monthly stock prices from Dec. 2013 to Dec 2015 Generate de criptive stics for five methor p et Problem & Analyse all the statistics and histograms and provide your you findings from Problem 2 Problem 4. Compte al mare capitalisation ) for the period between the year 2016 to the year of 2018 MC) -Price t) Share Outdingt) where t o a Compute yearly enterprise (EV) from 2014 to 2018 EV (1) - MIC($) - Cash Equivalents (t) + Prerred and Other (t) + Total Dett) Problem . Chand Equivales - Cash & Cash Equivales + Short Term love . Pred and Other Pred Equity and Head Capital /NoCosting . Debe-Short Term Da t es Term Debt Problem Computer yearly percentage of revenue growth change from 2014 to 2018. Reventet) - Revenue (t-1) Growth % (t) - 2 x 100 Revenue (t-1) where t represent year. For example, sett to 2014. Revenue (t) indicates revenue of year 2014 and Revenue (t-1) indicates revenue of year 2013 Problem 7. Compute gross profit and its margin percent from 2014 to 2018 Gross Profit (t) - Revenue (t) - Cost of Revenue (t) Gross Profitt) Grass Profit Margin (t)-- x 100 Revent) Problem 8. Calculate EBITDA and its margin percent from 2014 to 2018 EBITDA (t) Operating Income (Low) + Depreciation and Amortization EBITDA Margin % (t) - EBITDA (D) x 100 Problem 9. Compute Net Income (NI) and its margin percent from 2014 to 2018 NI (t) - Adjusted Net Income Available to Common (t) NI (t) x 100 NI Margin (0) Revenget) Problem 10. Compute Eearning Per Share (EPS) and its growth percent from 2014 to 2018. Adjusted Net Income Available to Common Shareholders (1) Basic Weighted Average Number of Share (t) EPS (t) - EPS (t-1) 100 EPS Growth % (t) - EPS (t-1) Problem 11. Compute Free Cash Flow (FCF) from 2014 to 2018 FCF (t) = Cash Flow from Operating Activities (t) - Capital Expenditure (ie. Purchase of Fixed Production Assets) (t) Problem 12. Compute Return on Equity (ROE). Return on Assets (ROA). Return on Capital (ROC) and Retum on Invested Capital (ROIC) from 2014 to 2018 ROE)Net Income Available to Common Shareholders based on GAAP (t) (Total Common Equity(t) +Total Common Equity (t-1))/2 where Total Common Equity-Share Capital and APIC (i.. APIC: additional paid in capital or capital surplus of common equity) + Retained Earning + Other Equity - Treasury Stock Also, we define Average Total Common Equity as (Total Common Equity(t)+Total Common Equity(t-1)/2 Net Income based on GAAP (t) Total Assets (t)+Total Assets (t-1))/2* 7 x 100 Problem 13. Interpret all the values for five companies and explain their performance. Pr ts and Erling Stocks 4 of 5 Poblem the profiles, se information ratio, for five stocking Bloomberg You seed to &EPS and industry information the woman within 200 Enter Ticker . Press EQUITY (F) yellow by Type DES . Click 1) Profile, 2) In ) Ratios, 4) R Problem 2. Read for each and to their E PS. 5) luty Indo potr the ive) .Enter Ticker Press EQUITY (FS) yellowly Type CN . Read Problem 3. Based on your findings from problem and problem 2. provide your thoughtforecast about their stock price trend over the fint half of year 2019 with supporting evidence Part 3 E ating Analysis 1. Next earning annonces for their c a re scheduled AMZN: 04/25/2019 MSFT: 01/24/2019 GE 01/18/2019 . NFLS: 04/15/2019 AAPL: 04/30/2019 Based on 1) your analysis (from problem llist and problem and problem 2 in part 2) and 2) information from Bloomberg 1) S et your opinion about Bloomberg 02/2019 estimates (Hint: with che evidence, try to A question whether a cow ar ds estima ) 2) Provide your 2019 met guideline for each sock band you may example, simply you might give an opinion of Buy AMZN "Sell - AMZN.) 2. Using Bloomberg provide actual Q2 earning measures (EPS Adj: ESS GAAAP. Ren. Net Income, Adj: Operating Profit: EBITDA) and the chart indicating aming for each stock In order to find them, follow the next step . Enter Tides Press EQUITY (FS) yellow by Type EE Press GO green key 1) What do you were from the actual Q2 caringa ! 2) Is there any big difference between your forecasts and actual earings? If yes, provide the reason of the gap thoroughly. 3. Download daily stock prices for five stocks (Jan 2018 - Sept 2019) using Bloomberg and compute monthly cumulative retums. Plot them in one figure over the period. 1) Which company does show the best performance based on the plot? 2) Did you expect this result based on your financial statement analysis? If yes, why? If not why not? Read carefully the below instruction before you begin project 2. Consolidate all excel spreadsheets from partl in a single Excel file. Make a cover page that includes names and ID numbers for your team on Sheetl in your EXCEL file. To submit this project electronically, use Blackboard. DO NOT send me it via email. Only one person (a group leader) in your team needs to submit the project. After grading, all the team members will get the same score for the attempt. Submit your project in a single EXCEL file. ONLY one EXCEL FILE will be accepted. You have to write up with your own words. Do not copy from others' work. You should show all your references for your project on the last sheet in your Excel. Also, you need to provide all the names (except your team members) you discussed on the last sheet as well. Note that this main goal of this project is to replicate "Key Stats" and "Profitability Ratios" on Bloomberg. If you just copy and paste the values from Bloomberg, you will get zero. You must show how to get the answers. All your answers that require computation must be computed using the collected data and Excel Part 1 Collecting Data and Computing financial indicators Instruction: You have been retained by an analytic unit of the SHB Brooklyn investment, LLC to provide an investment analysis report to the CEO of the company, Seungho Back. Your unit head asks you to evaluate a portfolio which consists of five stocks chosen by a junior fund manager as below I. Amazon, Inc. (Ticker: AMZN) II. Microsoft Corporation (Ticker: MSFT) III. General Electronic, Co. (Ticker: GE) IV. Netflix, Inc. (Ticker: NFLX) V. Apple, Inc. (Ticker: AAPL) Thus, you are about to generate kry variables, which are widely used in financial markets, so as to evaluate these companies using Bloomberg. The ley values include 1) Market Capitalization. 2) Enterprise Value, 3) Revenue, 4) Gross Profit, 5) Net Income, 6) EPS, 8) Cash from Operations, 7) Capital Expenditure, and 8) Free Cash Flow. | T-Mobile LTE 1:51 PM @ 50% X Project2.pdf Problem 1. To evaluate this pod stock you decide to collect historical 1) ock p e 2) 10 companies from B e rger The data period for this 2013 to Dee 2018 Dwa w the data is the one of th Befoe the bedre Er Tiere Press EQUITY (F) yellow les Type HP Press GO greeney Set monthly data frequency and data range from 12/31/2013 to 12/31/2015 . By changing MARKET me collect stock prices Last Price and sha d ing Cut Market Cap) . Click EXPORT TO EXCEL Also to find historical financial statements for a specific company in Bloomberg, follow the below procedures Eater Tick . Press EQUITY (FS) yellow by Type FA Press GO green key . ClickB/S (1/S) and select Standardiand (Note: for I/S you need download two state . Click EXPORT TO EXCEL Problem 2. Compute monthly stock returns for five stocks with monthly stock prices from Dec. 2013 to Dec 2015 Generate de criptive stics for five methor p et Problem & Analyse all the statistics and histograms and provide your you findings from Problem 2 Problem 4. Compte al mare capitalisation ) for the period between the year 2016 to the year of 2018 MC) -Price t) Share Outdingt) where t o a Compute yearly enterprise (EV) from 2014 to 2018 EV (1) - MIC($) - Cash Equivalents (t) + Prerred and Other (t) + Total Dett) Problem . Chand Equivales - Cash & Cash Equivales + Short Term love . Pred and Other Pred Equity and Head Capital /NoCosting . Debe-Short Term Da t es Term Debt Problem Computer yearly percentage of revenue growth change from 2014 to 2018. Reventet) - Revenue (t-1) Growth % (t) - 2 x 100 Revenue (t-1) where t represent year. For example, sett to 2014. Revenue (t) indicates revenue of year 2014 and Revenue (t-1) indicates revenue of year 2013 Problem 7. Compute gross profit and its margin percent from 2014 to 2018 Gross Profit (t) - Revenue (t) - Cost of Revenue (t) Gross Profitt) Grass Profit Margin (t)-- x 100 Revent) Problem 8. Calculate EBITDA and its margin percent from 2014 to 2018 EBITDA (t) Operating Income (Low) + Depreciation and Amortization EBITDA Margin % (t) - EBITDA (D) x 100 Problem 9. Compute Net Income (NI) and its margin percent from 2014 to 2018 NI (t) - Adjusted Net Income Available to Common (t) NI (t) x 100 NI Margin (0) Revenget) Problem 10. Compute Eearning Per Share (EPS) and its growth percent from 2014 to 2018. Adjusted Net Income Available to Common Shareholders (1) Basic Weighted Average Number of Share (t) EPS (t) - EPS (t-1) 100 EPS Growth % (t) - EPS (t-1) Problem 11. Compute Free Cash Flow (FCF) from 2014 to 2018 FCF (t) = Cash Flow from Operating Activities (t) - Capital Expenditure (ie. Purchase of Fixed Production Assets) (t) Problem 12. Compute Return on Equity (ROE). Return on Assets (ROA). Return on Capital (ROC) and Retum on Invested Capital (ROIC) from 2014 to 2018 ROE)Net Income Available to Common Shareholders based on GAAP (t) (Total Common Equity(t) +Total Common Equity (t-1))/2 where Total Common Equity-Share Capital and APIC (i.. APIC: additional paid in capital or capital surplus of common equity) + Retained Earning + Other Equity - Treasury Stock Also, we define Average Total Common Equity as (Total Common Equity(t)+Total Common Equity(t-1)/2 Net Income based on GAAP (t) Total Assets (t)+Total Assets (t-1))/2* 7 x 100 Problem 13. Interpret all the values for five companies and explain their performance. Pr ts and Erling Stocks 4 of 5 Poblem the profiles, se information ratio, for five stocking Bloomberg You seed to &EPS and industry information the woman within 200 Enter Ticker . Press EQUITY (F) yellow by Type DES . Click 1) Profile, 2) In ) Ratios, 4) R Problem 2. Read for each and to their E PS. 5) luty Indo potr the ive) .Enter Ticker Press EQUITY (FS) yellowly Type CN . Read Problem 3. Based on your findings from problem and problem 2. provide your thoughtforecast about their stock price trend over the fint half of year 2019 with supporting evidence Part 3 E ating Analysis 1. Next earning annonces for their c a re scheduled AMZN: 04/25/2019 MSFT: 01/24/2019 GE 01/18/2019 . NFLS: 04/15/2019 AAPL: 04/30/2019 Based on 1) your analysis (from problem llist and problem and problem 2 in part 2) and 2) information from Bloomberg 1) S et your opinion about Bloomberg 02/2019 estimates (Hint: with che evidence, try to A question whether a cow ar ds estima ) 2) Provide your 2019 met guideline for each sock band you may example, simply you might give an opinion of Buy AMZN "Sell - AMZN.) 2. Using Bloomberg provide actual Q2 earning measures (EPS Adj: ESS GAAAP. Ren. Net Income, Adj: Operating Profit: EBITDA) and the chart indicating aming for each stock In order to find them, follow the next step . Enter Tides Press EQUITY (FS) yellow by Type EE Press GO green key 1) What do you were from the actual Q2 caringa ! 2) Is there any big difference between your forecasts and actual earings? If yes, provide the reason of the gap thoroughly. 3. Download daily stock prices for five stocks (Jan 2018 - Sept 2019) using Bloomberg and compute monthly cumulative retums. Plot them in one figure over the period. 1) Which company does show the best performance based on the plot? 2) Did you expect this result based on your financial statement analysis? If yes, why? If not why not
Step by Step Solution
There are 3 Steps involved in it

Get step-by-step solutions from verified subject matter experts