

Question: Read from A Practical Guide to Conjoint Analysis article.Refer to Table 2 of the article(Attached below). 1.Calculate the importance of the different attributes (present them
Read from A Practical Guide to Conjoint Analysis article.Refer to Table 2 of the article(Attached below).
1.Calculate the importance of the different attributes (present them as a table).
2.Consider a Toyota with 280 horsepower, leather interior, no sunroof and a price of $23,000. Now assume that the manufacturer is offering the car with sunroof. What is the price that consumers would be willing to pay for this car?Please state clearly your computations and your assumptions.
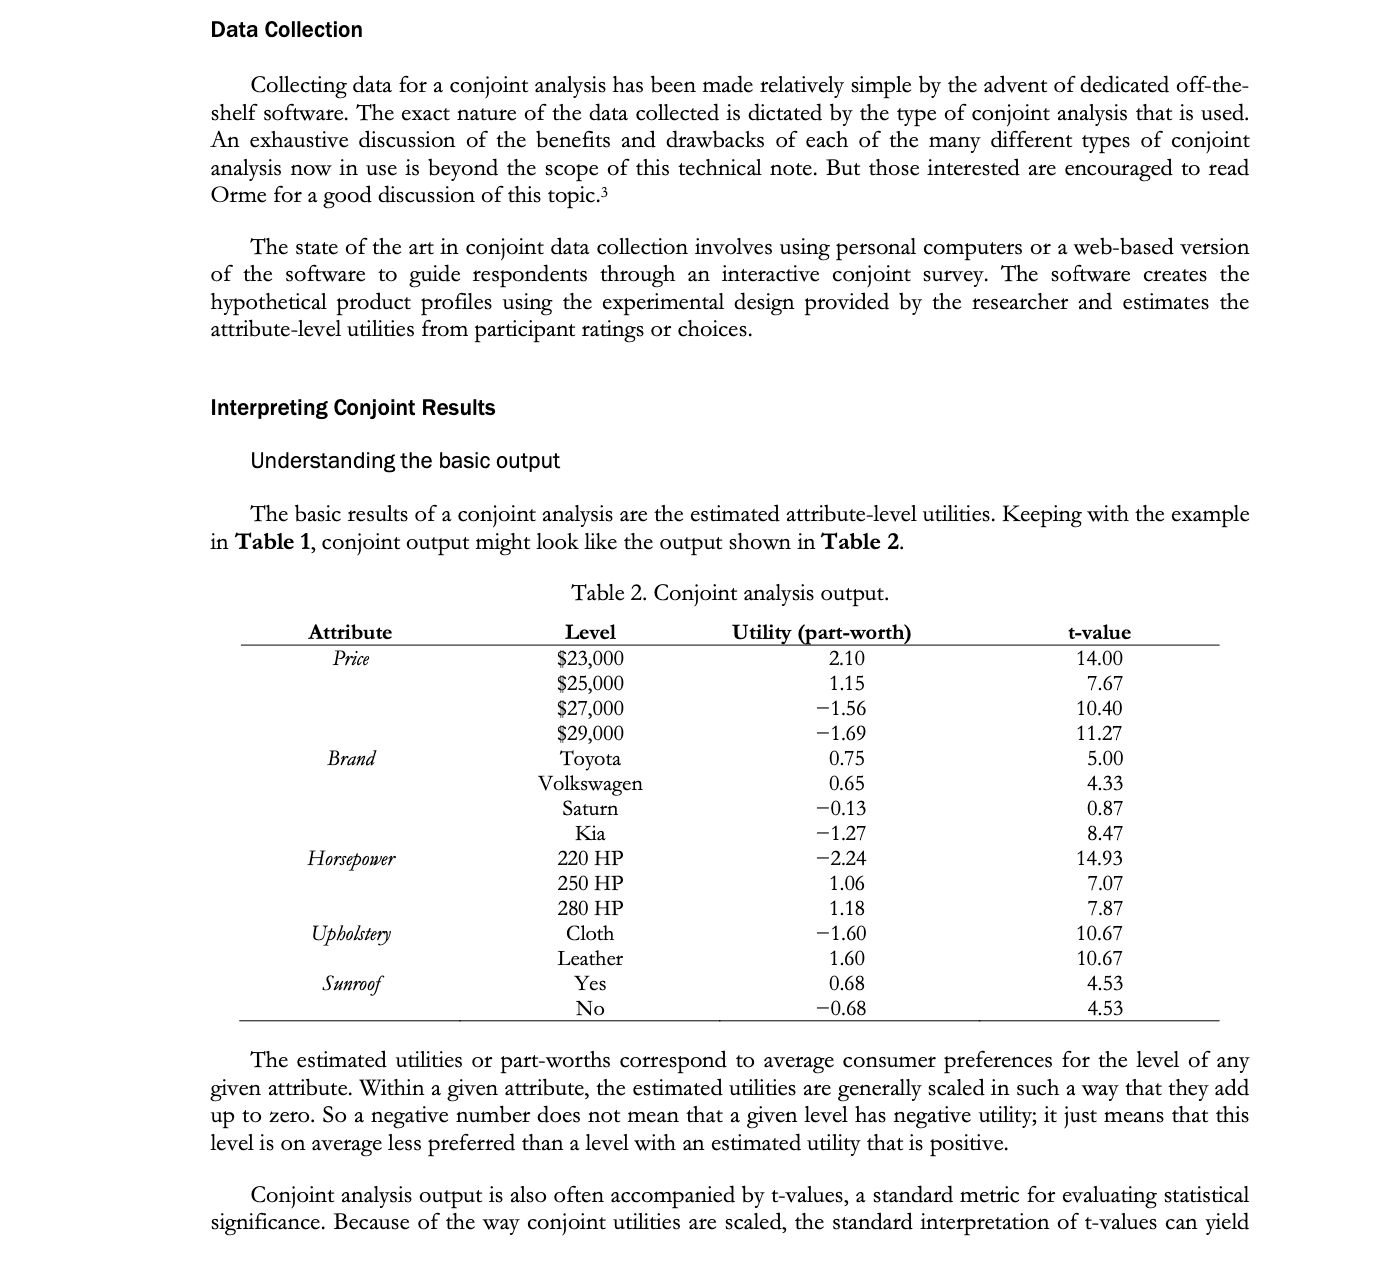
Data Collection Collecting data for a conjoint analysis has been made relatively simple by the advent of dedicated off-the- shelf software. The exact nature of the data collected is dictated by the type of conjoint analysis that is used. An exhaustive discussion of the benets and drawbacks of each of the many different types of conjoint analysis now in use is beyond the scope of this technical note. But those interested are encouraged to read Orme for a good discussion of this topic.3 The state of the art in conjoint data collection involves using personal computers or a web-based version of the software to guide respondents through an interactive conjoint survey. The software creates the hypothetical product proles using the experimental design provided by the researcher and estimates the attributelevel utilities from participant ratings or choices. Interpreting Conjoint Results Understanding the basic output The basic results of a conjoint analysis are the estimated attribute-level utilities. Keeping with the example in Table 1, conjoint output might look like the Output shown in Table 2. Table 2. Conjoint analysis output. Attribute Level Utility mart-worth! t-value Price $23,000 2.10 14.00 $25,000 1.15 7.67 $27,000 - 'l .56 10.40 329,000 1.69 11.27 Brand Toyota 0.75 5.00 Volkswagen 0.65 4.33 Saturn 0.1 3 0.37 Kia l .27 8.47 Homepamr 220 HP -2.24 14.93 250 HP 1 .06 7.07 280 HP 1 .13 7.37 Upbairfery Cloth - '1 .60 10.67 Leather 1.60 10.67 Sunmgf Yes 0.63 4.53 No -0.63 4.53 The estimated utilities or part-worths correspond to average consumer preferences for the level of any given attribute. Within a given attribute, the estimated utilities are generally scaled in such a way that they add up to zero. So a negative number does not mean that a given level has negave utility; it just means that this level is on average less preferred than a level with an estimated utility that is positive. Conjoint analysis output is also often accompanied by t-values, a standard metric for evaluating statistical significance. Because of the way conjoint utilities are scaled, the standard interpretation of tvalues can yield
Step by Step Solution
There are 3 Steps involved in it

Get step-by-step solutions from verified subject matter experts