

Question: read problem p2-49 and answer the questions P2-49. Compare Operating Characteristics Across Industries Following are selected income statement and balance sheet data for companies in
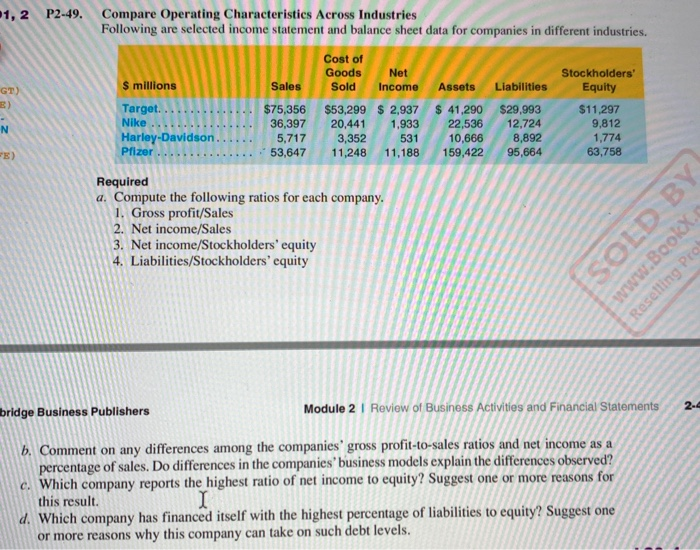
P2-49. Compare Operating Characteristics Across Industries Following are selected income statement and balance sheet data for companies in different industries. GT) Sales Assets $ millions Target... Nike Harley-Davidson Pfizer Cost of Goods Net Sold Income $53,299 $ 2,937 20,441 1,933 3,352 531 11,248 11,188 $75,356 36,397 5,717 53,647 N $ 41,290 22,536 10,666 159,422 Stockholders' Equity $11,297 9,812 1,774 63,758 Liabilities $29,993 12,724 8,892 95,664 PE) Required a. Compute the following ratios for each company. 1. Gross profit/Sales 2. Net income/Sales 3. Net income/Stockholders' equity 4. Liabilities/Stockholders' equity | SOLD BY www.Boolex Reselling Pro 2-4 bridge Business Publishers Module 2 | Review of Business Activities and Financial Statements b. Comment on any differences among the companies' gross profit-to-sales ratios and net income as a percentage of sales. Do differences in the companies' business models explain the differences observed? c. Which company reports the highest ratio of net income to equity? Suggest one or more reasons for this result. I d. Which company has financed itself with the highest percentage of liabilities to equity? Suggest one or more reasons why this company can take on such debt levels
Step by Step Solution
There are 3 Steps involved in it

Get step-by-step solutions from verified subject matter experts