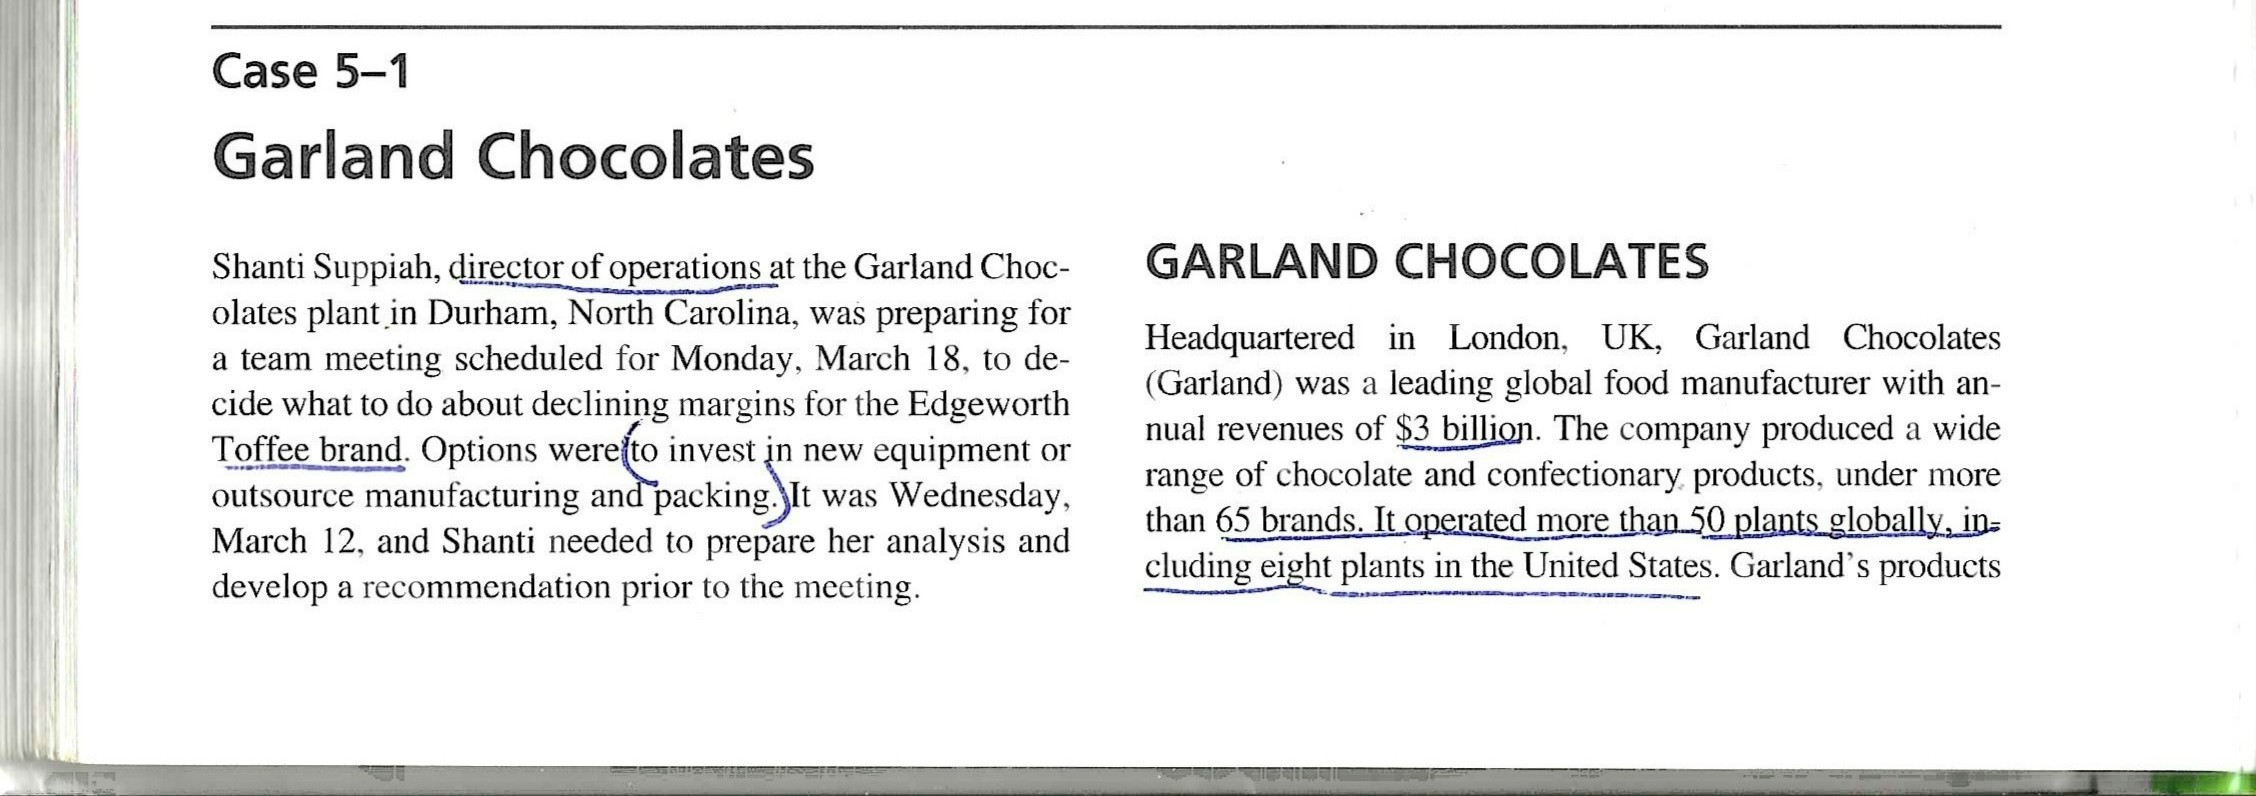
Question: Read PSM Case 5-1 Garland Chocolates #1, PSM Case 5-1 Garland Chocolates #2, and PSM Case 5-1 Garland Chocolates #3 and prepare three 10-year cashflow
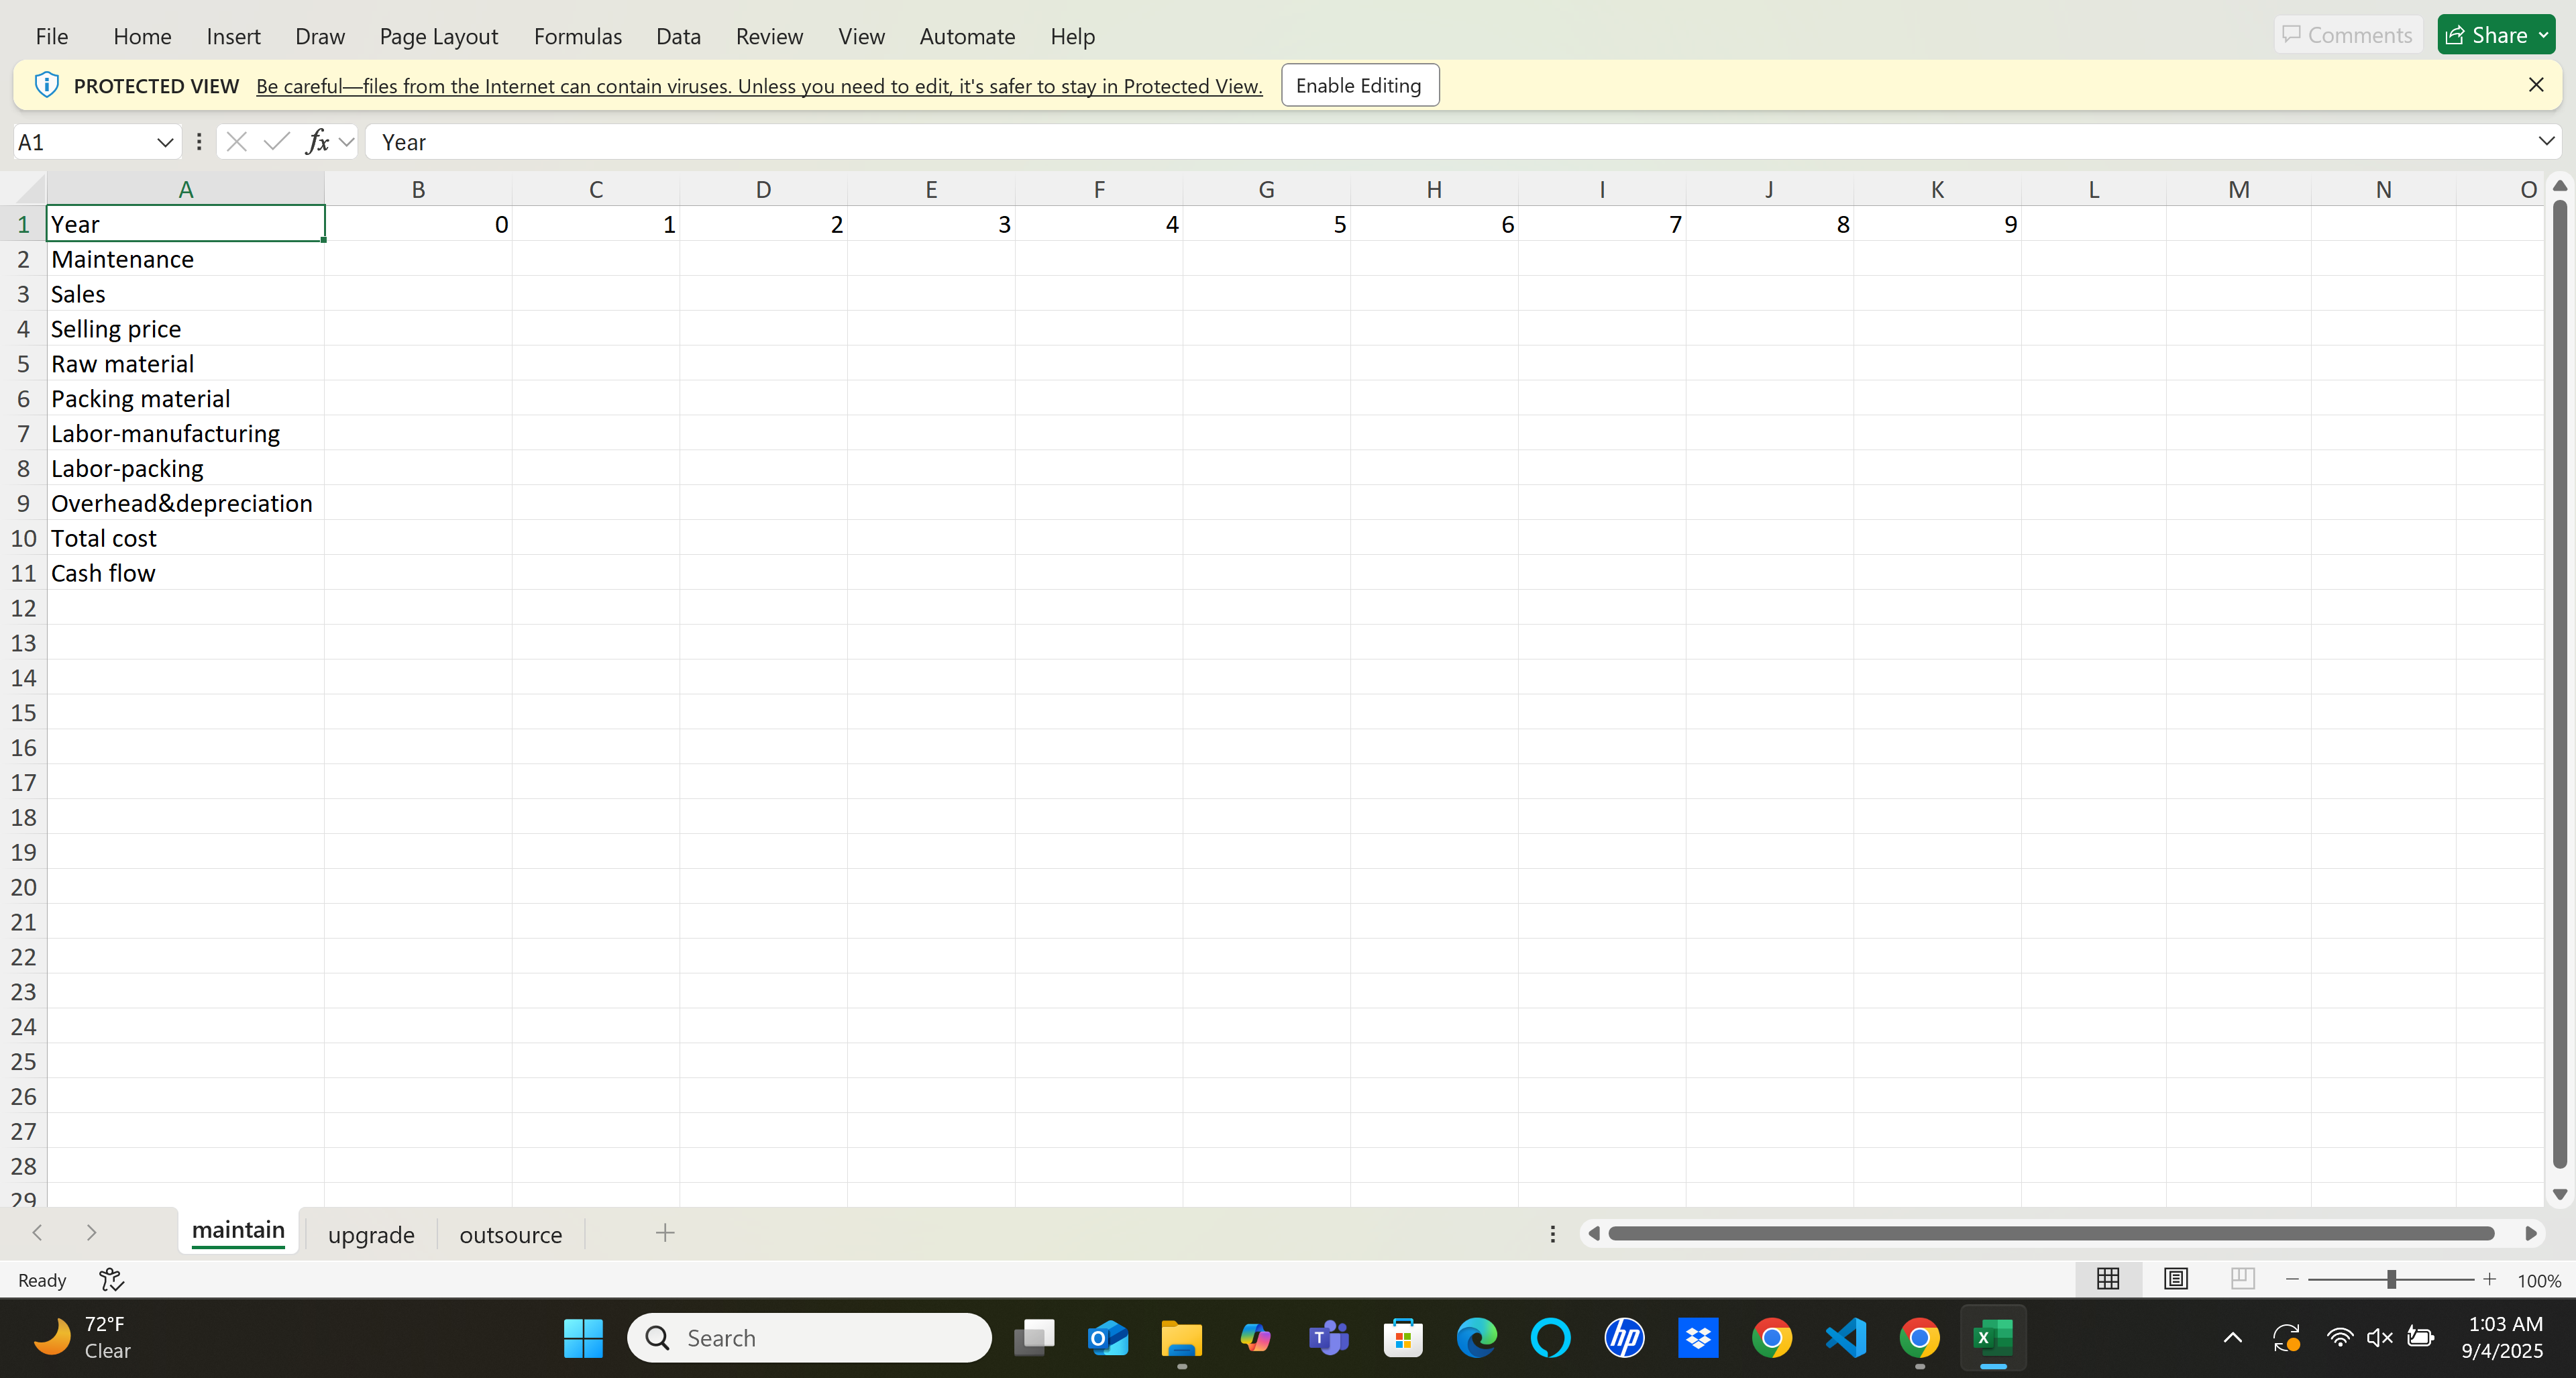
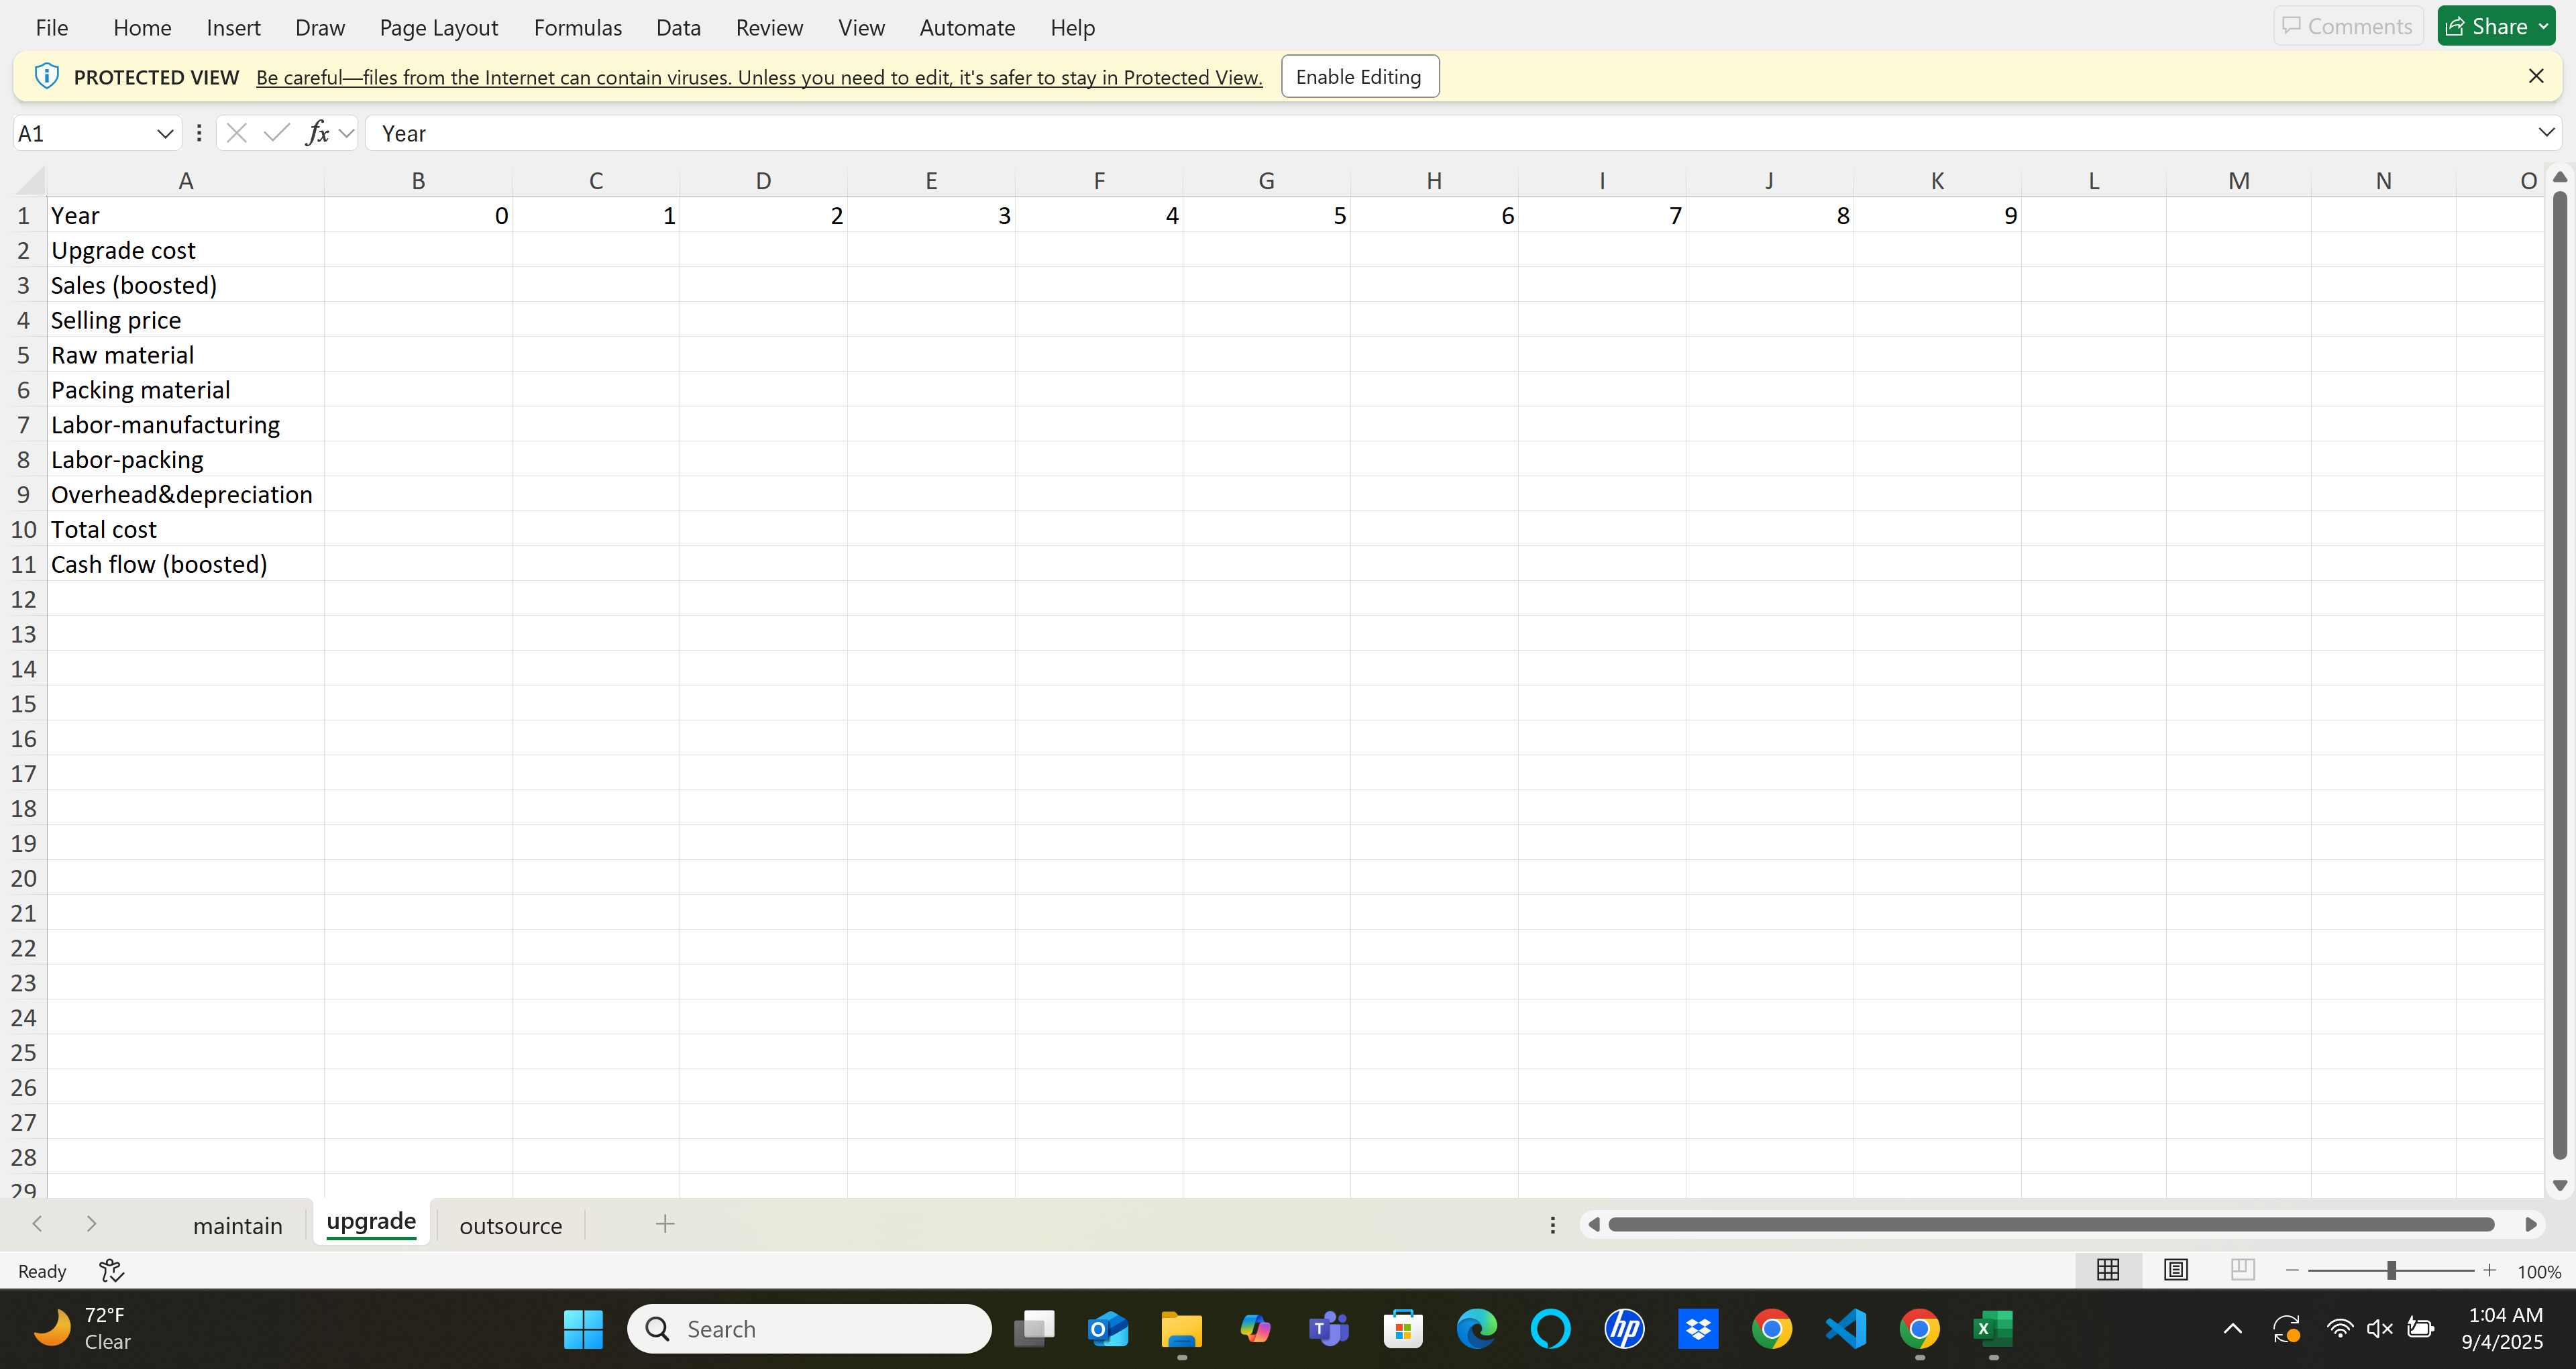
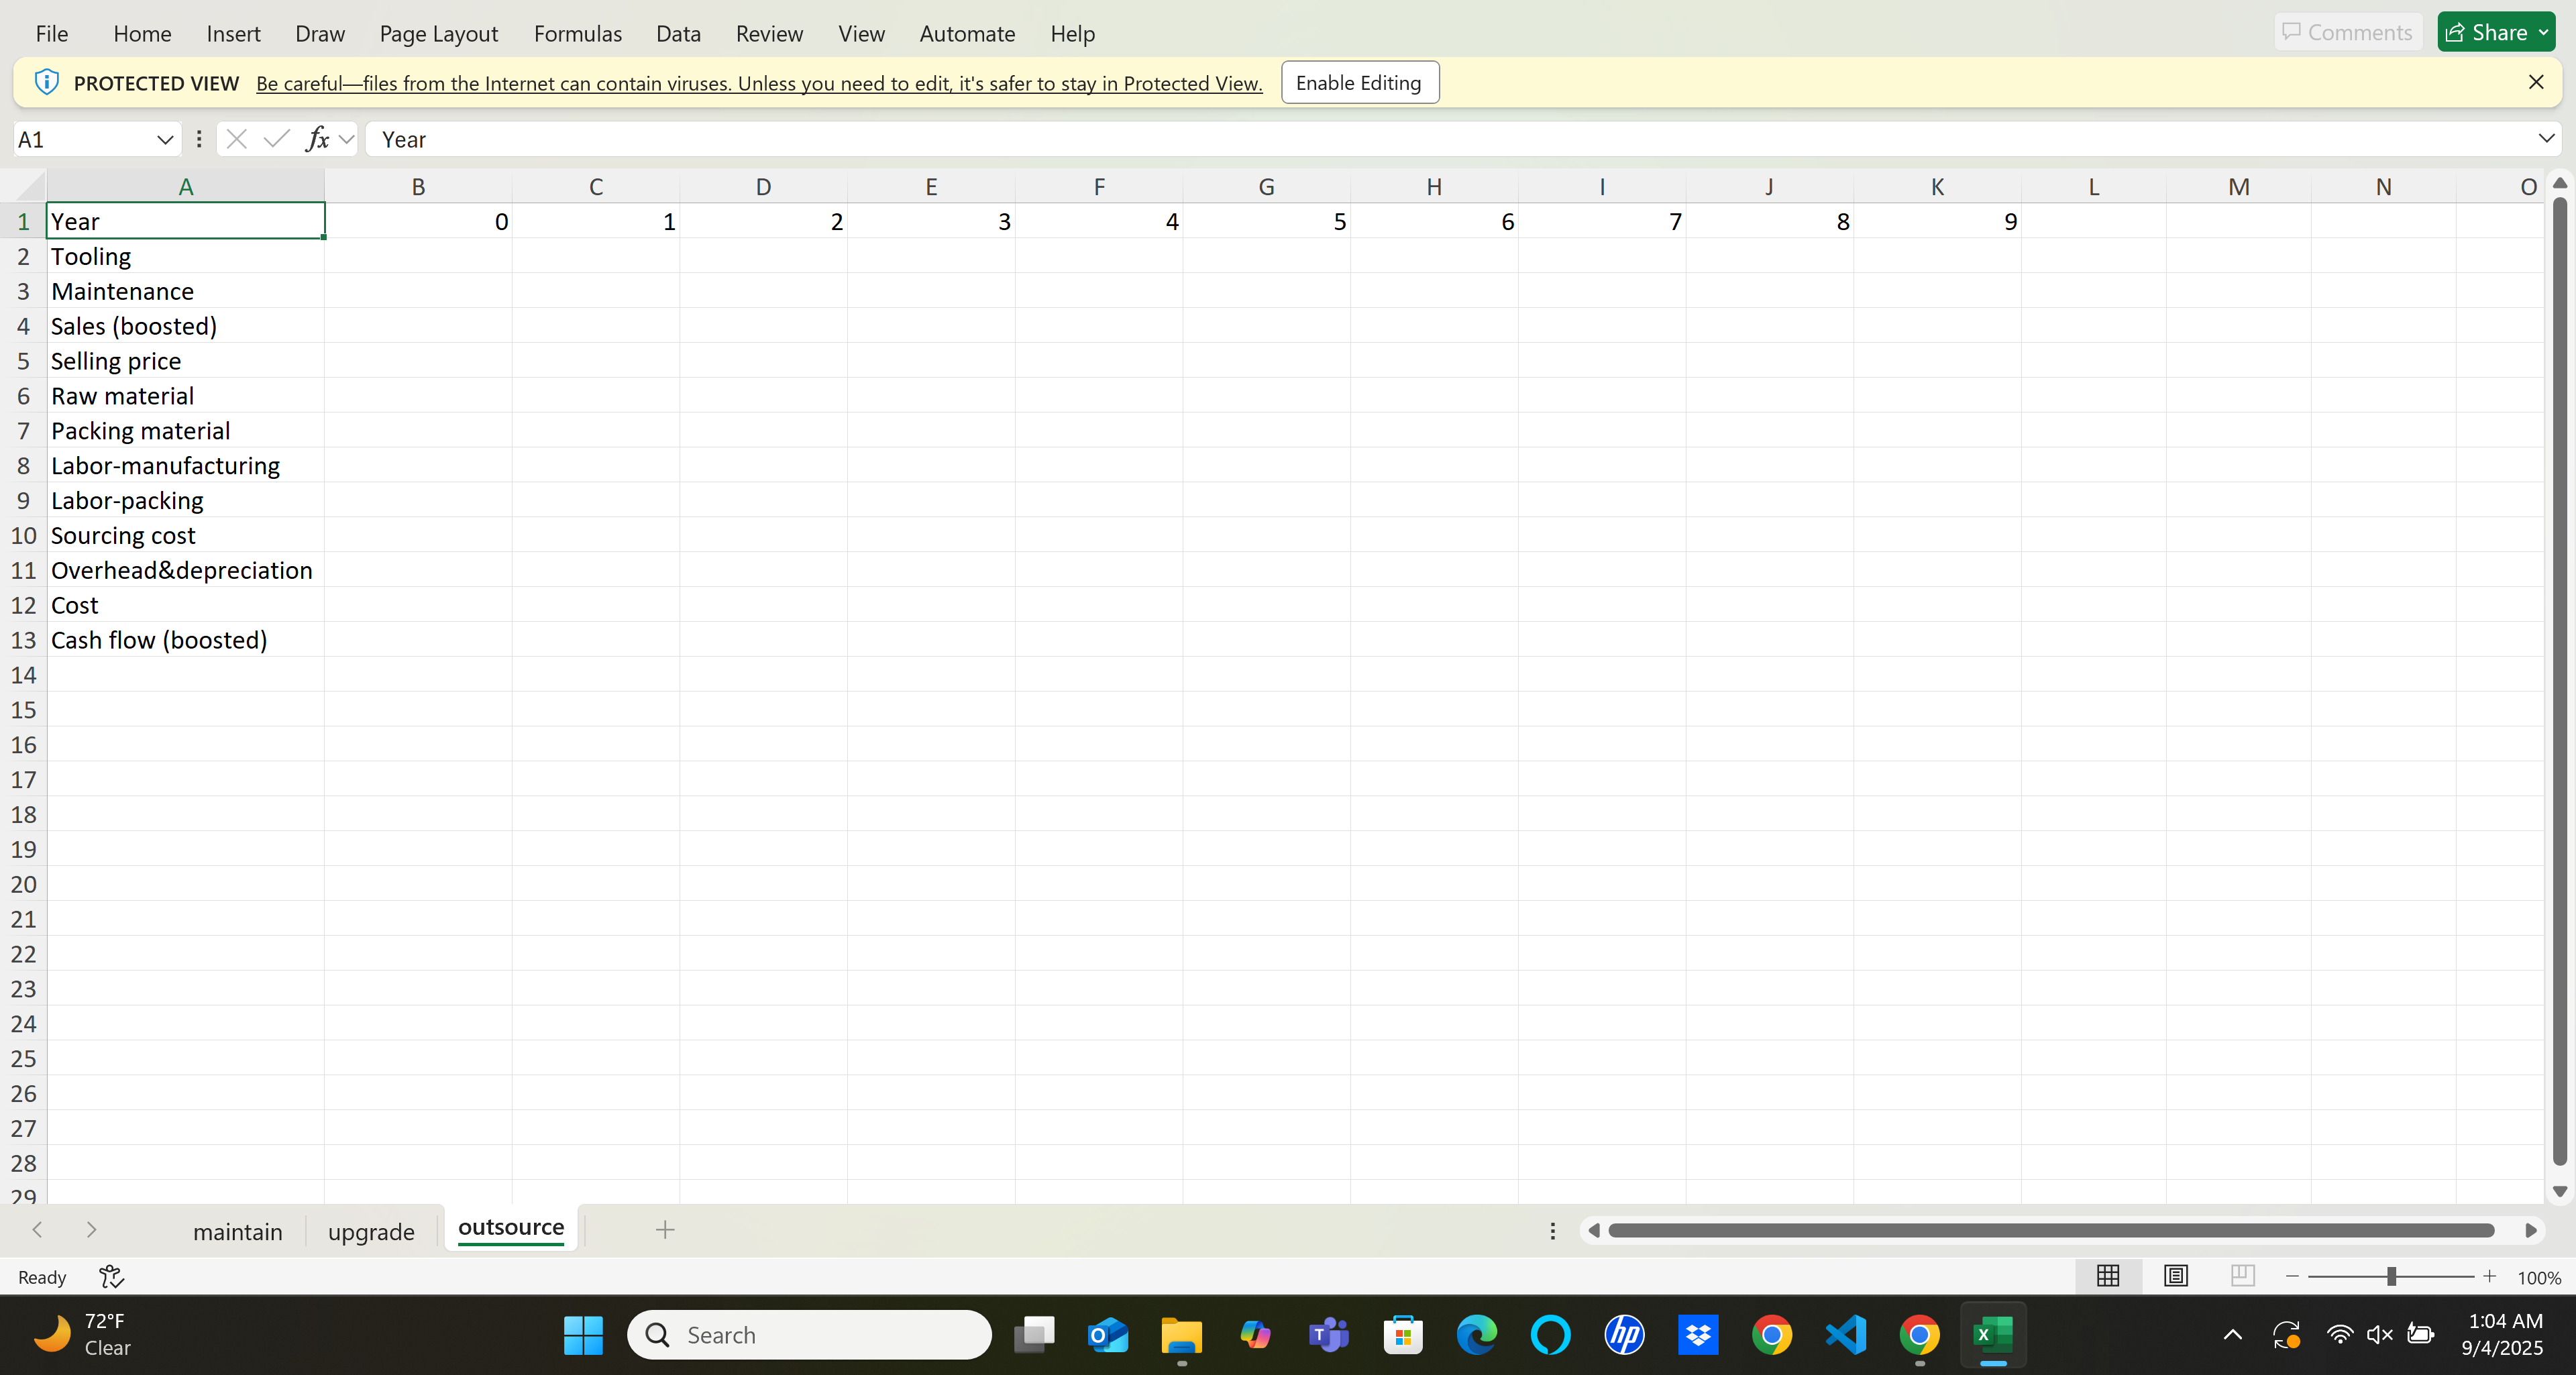
Read "PSM Case 5-1 Garland Chocolates #1", "PSM Case 5-1 Garland Chocolates #2", and "PSM Case 5-1 Garland Chocolates #3" and prepare three 10-year cashflow spreadsheets for three scenarios---maintaining the current lines, upgrading the lines, and outsourcing---using the attached "garland_template #1","garland_template #2","garland_template #3" and submit the completed spreadsheets. It should be straightforward to see that in each year, cashflow = sales volume * (selling price - unit production cost) - fixed costs.
Please only use explicit information provided in the case. For example, when the case states "annual maintenance cost...expected to increase by at least 25 percent in the next 12 months", you can assume that the cost will increase exactly 25% for the next year and remain at this level for future years. If you feel uncertain about how to interpret assumptions, you may state your interpretations clearly in the spreadsheet. As long as these interpretations are reasonable and clearly stated, you will receive due credit even though your numbers may not match the solution.
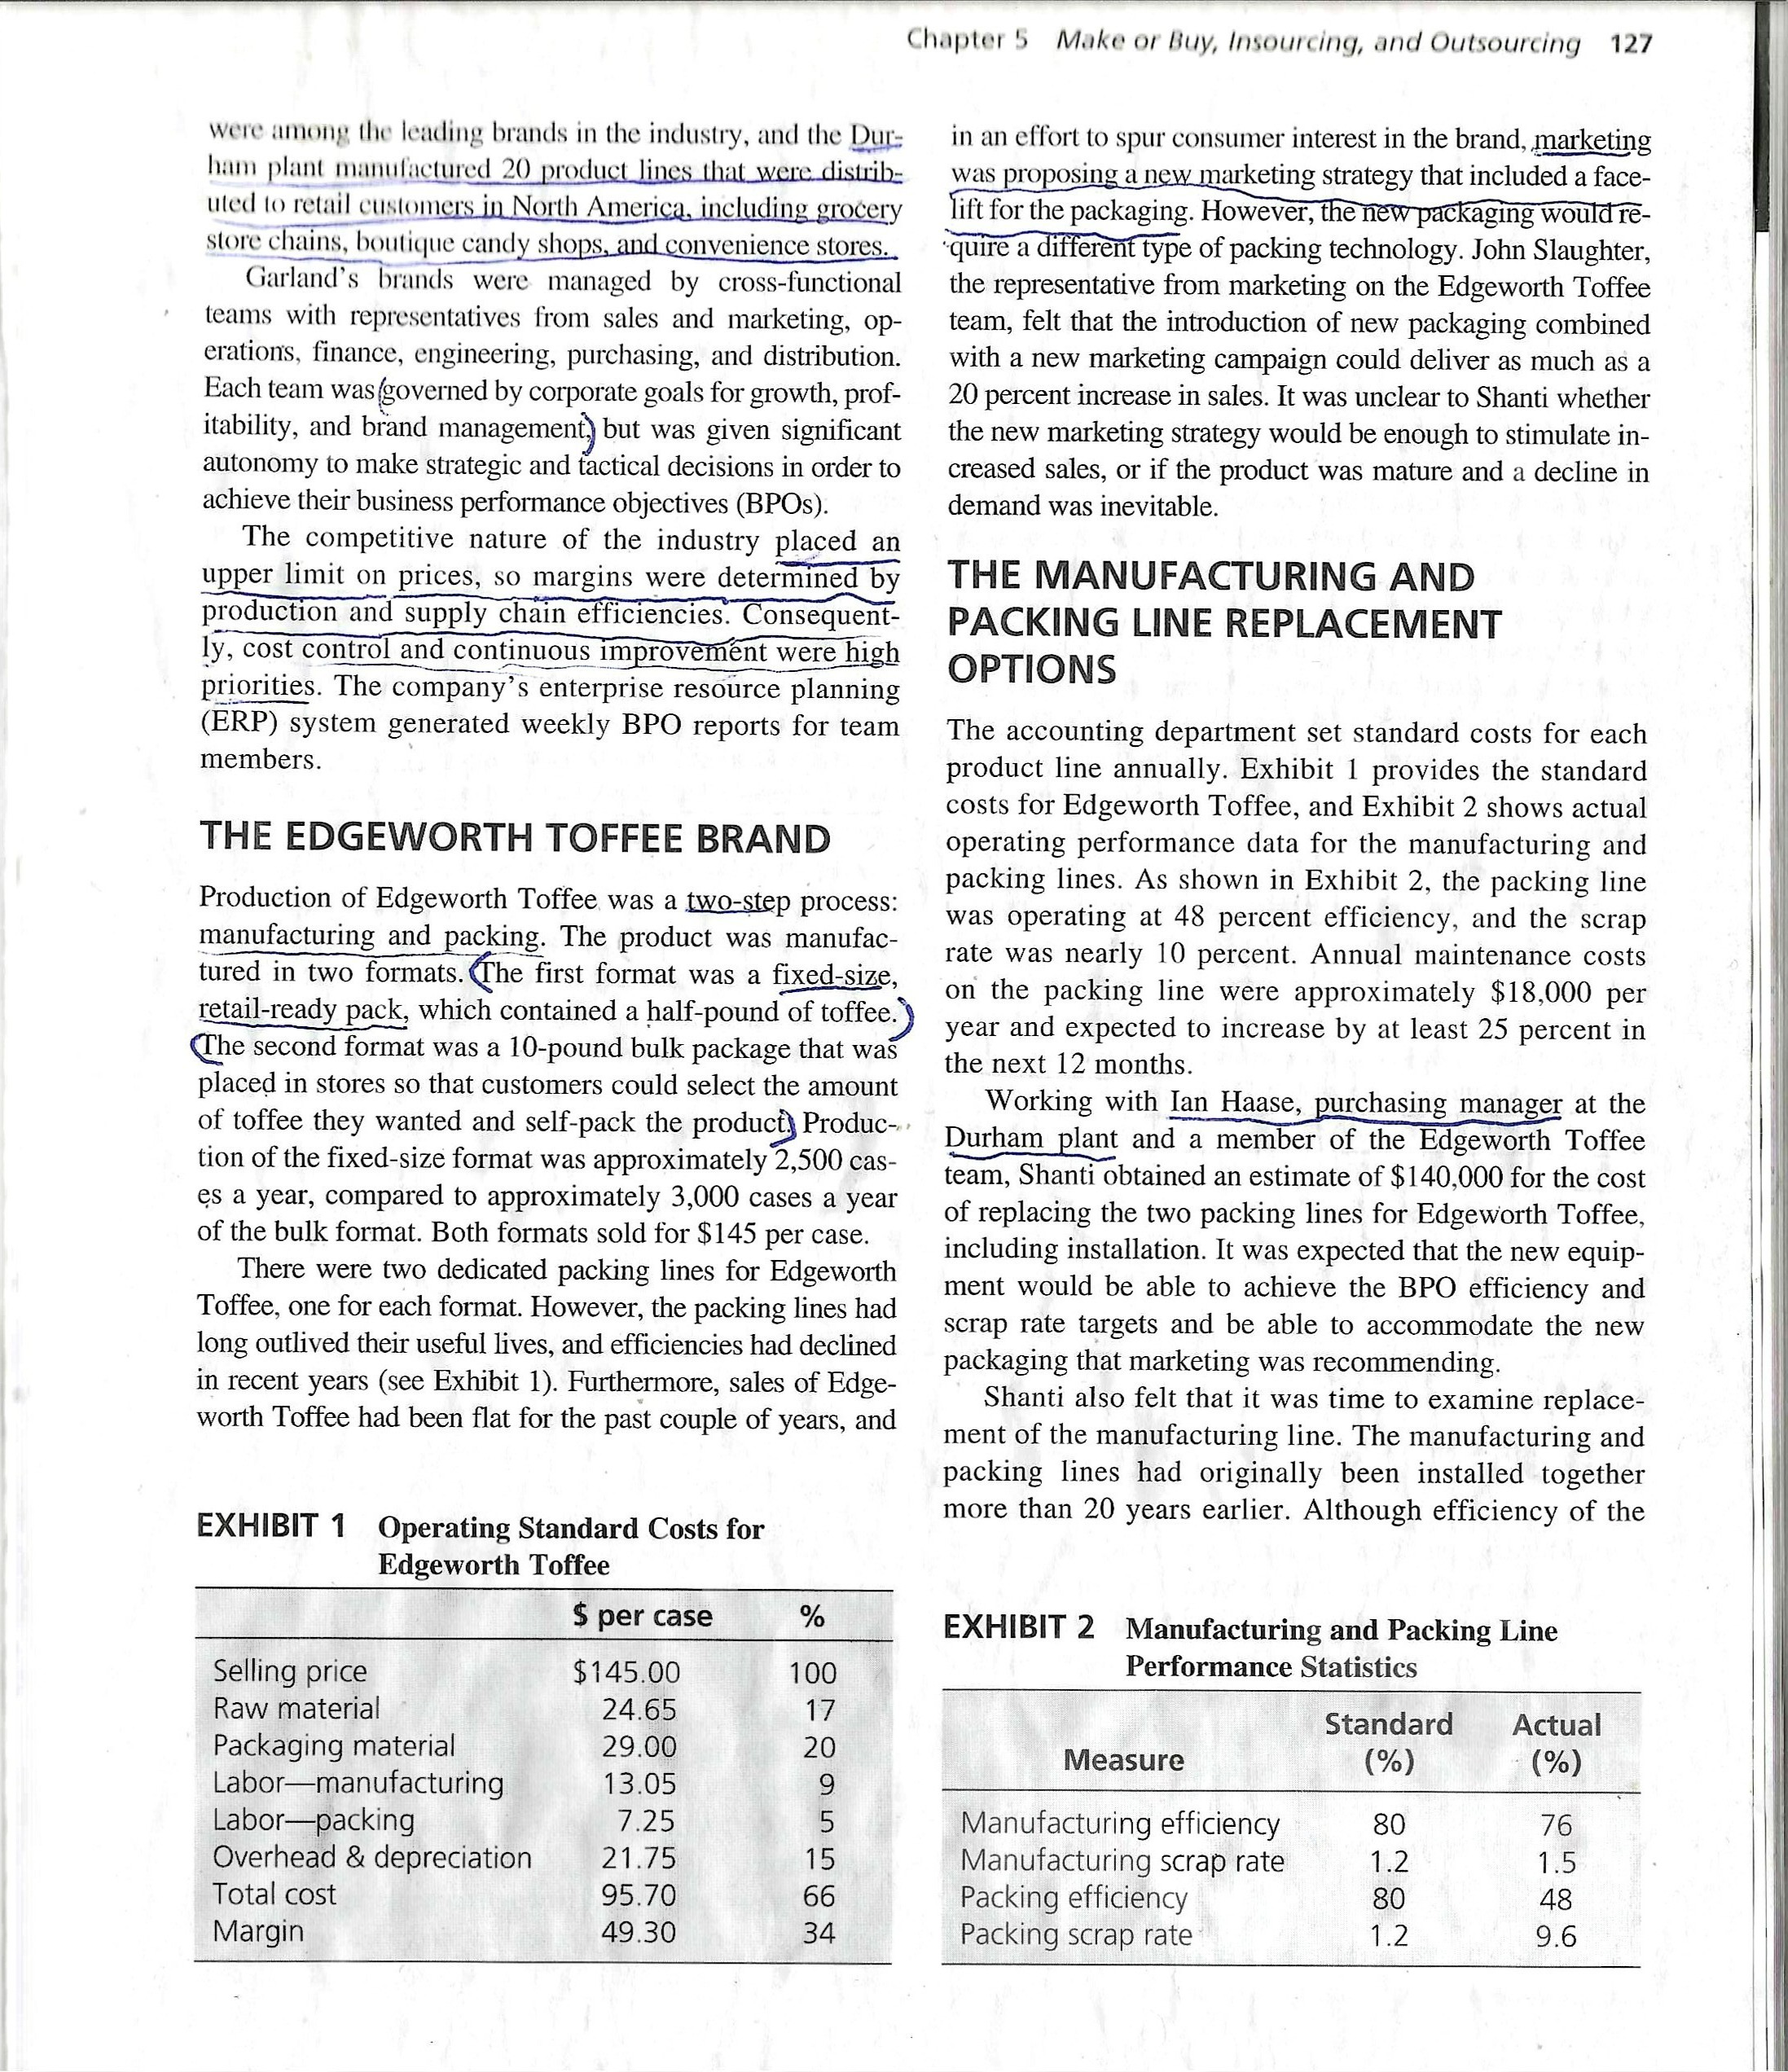
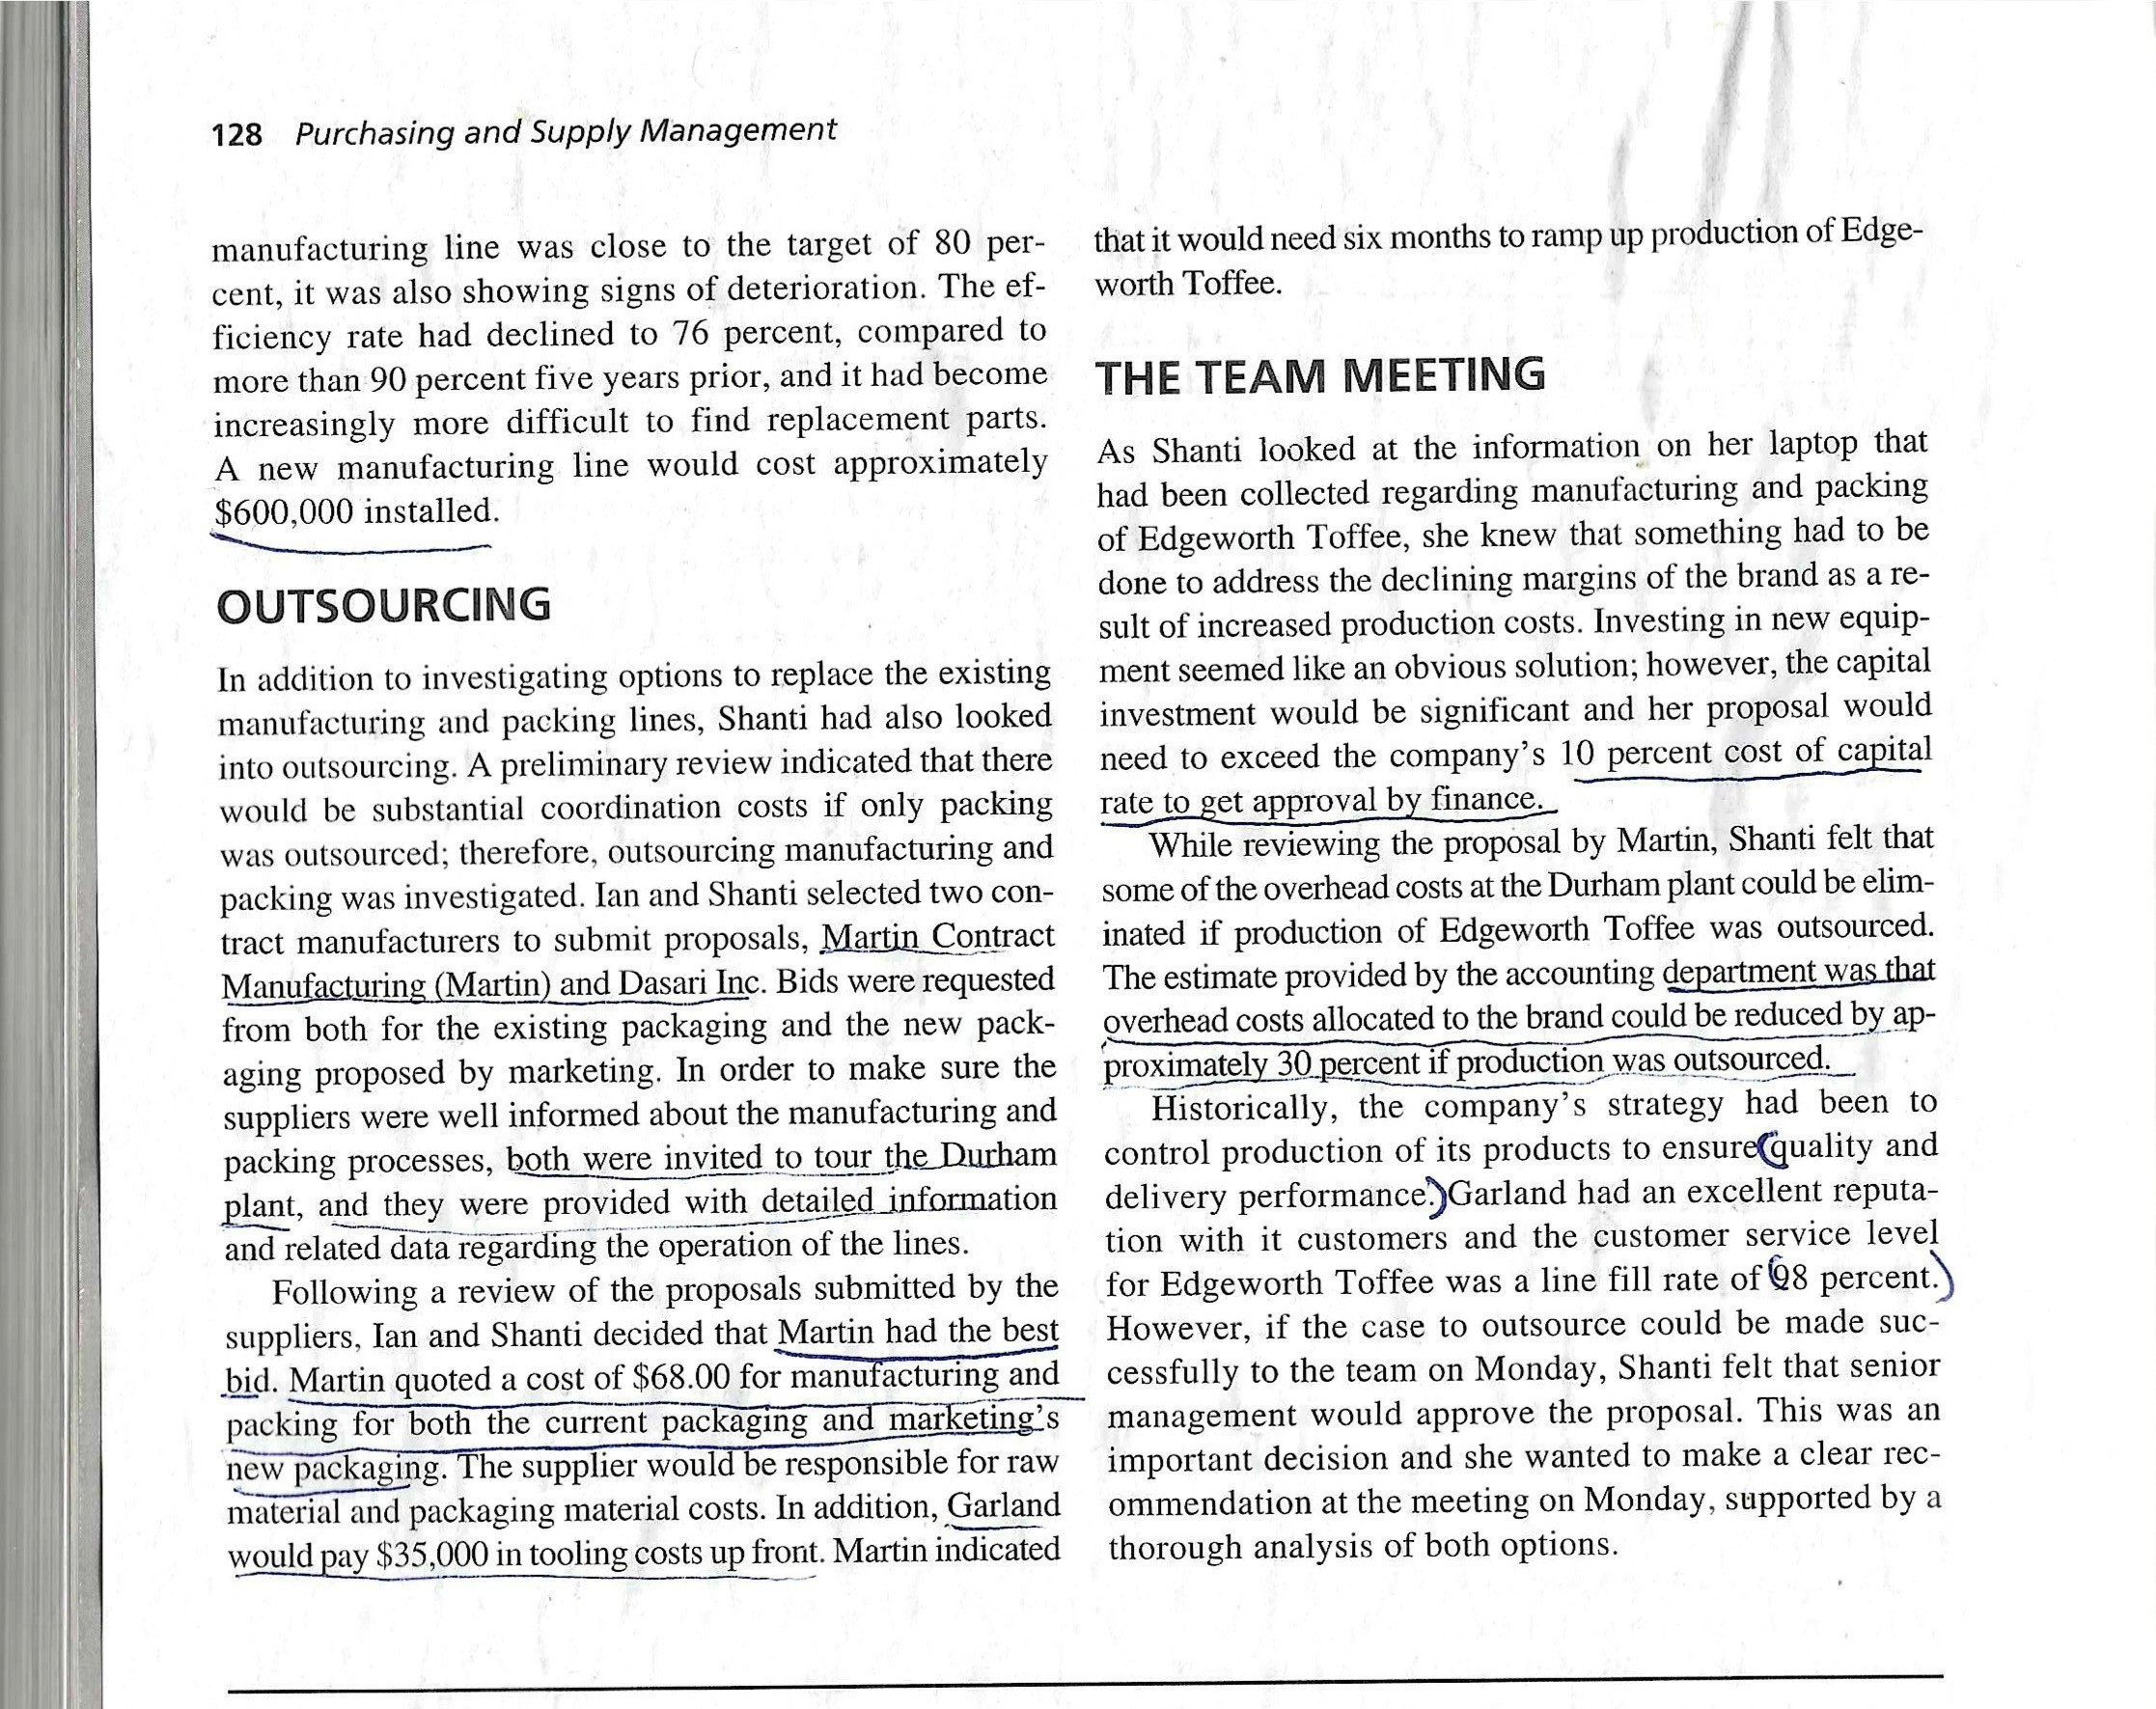
Exhibit 1 lists the standard costs, rather than actual costs, of current operations. Exhibit 2 shows that the actual scrap rates deviate from the standard scrap rates. The standard material costs are based on the standard scrap rate rather than the deteriorated actual scrap rate. You need to adjust the standard raw/packing material costs based on the standard and actual manufacturing/packing scrap rates to calculate the actual costs. For example, if the standard raw material cost is $100 and the standard manufacturing scrap rate is 10%, it implies that although $100 worth of material is consumed in manufacturing one unit of the product, only $90 worth of the material actually enters the product and $10 worth of material is wasted as scrap. Therefore, if the actual manufacturing scrap rate is 20%, the actual raw material cost must be $90 / (1-20%) = $112.5. The labor costs do not need to be adjusted.
For the maintenance option, you may assume that the stated maintenance cost of $18,000 is per packing line.
For the outsourcing option, the case states "it would need six months to ramp up production", therefore you should assume that while the tooling cost is incurred in year 0, the outsourcing operation takes effect starting year 1. You may also make the assumption that the outsourcing option adopts marketing's new packaging design and thus enjoys the 20% increase in sales.
The tooling costs in the outsourcing option are one-time costs of providing assets specific to your needs (e.g., molds) to the contract manufacturer. They are provided by the client and often retained ownership by the client because the manufacturer has no use of and is not allowed to use them for other clients.
File Home Insert Draw Page Layout Formulas Data Review View Automate Help Comments Share @ PROTECTED VIEW Be careful-files from the Internet can contain viruses. Unless you need to edit, it's safer to stay in Protected View. Enable Editing X A1 viX fx Year A B C D E F G H J K L M N O 1 Year 0 1 2 3 4 5 6 7 8 9 Maintenance 3 Sales 4 Selling price 5 Raw material 6 Packing material 7 Labor-manufacturing 8 Labor-packing 9 Overhead&depreciation 10 Total cost 11 Cash flow 12 13 14 15 16 17 18 19 20 21 22 23 24 25 26 27 28 29 maintain upgrade outsource Ready + 100% 72.F Q Search O hp 9X X 1:03 AM Clear 9/4/2025File Home Insert Draw Page Layout Formulas Data Review View Automate Help Comments Share @ PROTECTED VIEW Be careful-files from the Internet can contain viruses. Unless you need to edit, it's safer to stay in Protected View. Enable Editing X A1 viX fx Year A B C D E F G H J K L M N O 4 Year 0 1 2 3 4 5 6 7 8 9 2 Upgrade cost Sales (boosted) Selling price 5 Raw material 6 Packing material 7 Labor-manufacturing 8 Labor-packing 9 Overhead&depreciation 10 Total cost 11 Cash flow (boosted) 12 13 14 15 16 17 18 19 20 21 22 23 24 25 26 27 28 29 maintain upgrade outsource Ready + 100% 72.F Clear Q Search hp $ 9 x 9 X 1:04 AM 9/4/2025File Home Insert Draw Page Layout Formulas Data Review View Automate Help Comments Share PROTECTED VIEW Be careful-files from the Internet can contain viruses. Unless you need to edit, it's safer to stay in Protected View. Enable Editing X A1 VIXfx Year B C D E F G H J K L M N 1 Year 0 1 2 3 4 5 6 7 8 9 2 Tooling 3 Maintenance 4 Sales (boosted) 5 Selling price 6 Raw material Packing material 8 Labor-manufacturing 9 Labor-packing 10 Sourcing cost 11 Overhead&depreciation 12 Cost 13 Cash flow (boosted) 14 15 16 17 18 19 20 21 22 23 24 25 26 27 28 29 maintain upgrade outsource Ready + 100% 72.F Q Search O hp 9X X 1:04 AM Clear 9/4/2025Case 5-1 Garland Chocolates Shanti Suppiah, director of operations at the Garland Choc- GARLAND CHOCOLATES olates plant in Durham, North Carolina, was preparing for a team meeting scheduled for Monday, March 18, to de- Headquartered in London, UK, Garland Chocolates cide what to do about declining margins for the Edgeworth (Garland) was a leading global food manufacturer with an- Toffee brand. Options were(to invest in new equipment or nual revenues of $3 billion. The company produced a wide outsource manufacturing and packing. It was Wednesday, range of chocolate and confectionary products, under more March 12, and Shanti needed to prepare her analysis and than 65 brands. It operated more than 50 plants globally, in- develop a recommendation prior to the meeting. cluding eight plants in the United States. Garland's productswere among the leading brands in the ana and the Dut: ham plant manufactured 20 produc : ore. uted to retail customers in North America, including grocery store chains, boutique candy shops, and convenience stores. Garland's brands were managed by cross-functional teams with representatives from sales and marketing, op- erations, finance, engineering, purchasing, and distribution. Each team was governed by corporate goals for growth, prof- itability, and brand management) but was given significant autonomy to make strategic and tactical decisions in order to achieve their business performance objectives (BPOs). The competitive nature of the industry placed an upper limit on prices, so margins were determined by production and supply chain efficiencies. Consequent- ly. cost conirol and continuous improvement were h high priorities. The company's enterprise resource planning (ERP) system generated weekly BPO reports for team members. THE EDGEWORTH TOFFEE BRAND Production of Edgeworth Toffee was a two-step process: manufacturing and packing. The product was manufac- tured in two formats. he first format was a fixed- Size, retail-ready pack, which contained a half-pound of toffee. The second format was a 10-pound bulk package that was placed in stores so that customers could select the amount of toffee they wanted and self-pack the product} Produc- tion of the fixed-size format was approximately 2,500 cas- es a year, compared to approximately 3,000 cases a year of the bulk format. Both formats sold for $145 per case. There were two dedicated packing lines for Edgeworth Toffee, one for each format. However, the packing lines had long outlived their useful lives, and efficiencies had declined in recent years (see Exhibit 1). Furthermore, sales of Edge- worth Toffee had been flat for the past couple of years, and EXHIBIT 1 Operating Standard Costs for Edgeworth Toffee $ per case % Selling price $145.00 100 Raw material 24.65 17 Packaging material 29.00 20 Labormanufacturing 13.05 9 Laborpacking W25 5 Overhead & depreciation 21.75 15 Total cost 95.70 66 Margin 49.30 34 Chapter 5 Make or Buy, Insourcing, and Outsourcing 127 in an effort to spur consumer interest in the brand, marketing was proposing a new marketing strategy that included a face- ift for the packaging. However, the ckaging would re- \"quire a different type of packing technology. John Slaughter, the representative from marketing on the Edgeworth Toffee team, felt that the introduction of new packaging combined with a new marketing campaign could deliver as much as a 20 percent increase in sales. It was unclear to Shanti whether the new marketing strategy would be enough to stimulate in- creased sales, or if the product was mature and a decline in demand was inevitable. THE MANUFACTURING AND PACKING LINE REPLACEMENT OPTIONS The accounting department set standard costs for each product line annually. Exhibit 1 provides the standard costs for Edgeworth Toffee, and Exhibit 2 shows actual operating performance data for the manufacturing and packing lines. As shown in Exhibit 2, the packing line was operating at 48 percent efficiency, and the scrap rate was nearly 10 percent. Annual maintenance costs on the packing line were approximately $18,000 per year and expected to increase by at least 25 percent in the next 12 months. Working with Ian Haase, purchasing manager at the Durham plant and a member of the Edgeworth Toffee team, Shanti obtained an estimate of $140,000 for the cost of replacing the two packing lines for Edgeworth Toffee, including installation. It was expected that the new equip- ment would be able to achieve the BPO efficiency and scrap rate targets and be able to accommodate the new packaging that marketing was recommending. Shanti also felt that it was time to examine replace- ment of the manufacturing line. The manufacturing and packing lines had originally been installed together more than 20 years earlier. Although efficiency of the EXHIBIT 2 Manufacturing and Packing Line Performance Statistics Standard Actual Measure (%) (%) Manufacturing efficiency 80 76 Manufacturing scrap rate 1.2 15 Packing efficiency 80 A8 Packing scrap rate 1.2 9.6 128 Purchasing and Supply Management manufacturing line was close to the target of 80 per- cent, it was also showing signs of deterioration. The ef- ficiency rate had declined to 76 percent, compared to more than 90 percent five years prior, and it had become increasingly more difficult to find replacement parts. A new manufacturing line would cost approximately $600,000 installed. epee OUTSOURCING In addition to investigating options to replace the existing manufacturing and packing lines, Shanti had also looked into outsourcing. A preliminary review indicated that there would be substantial coordination costs if only packing was outsourced; therefore, outsourcing manufacturing and packing was investigated. Ian and Shanti selected two con- tract manufacturers to submit proposals, Martin Contract Manufacturing (Martin) and Dasari Inc. Bids were requested from both for the existing packaging and the new pack- aging proposed by marketing. In order to make sure the suppliers were well informed about the manufacturing and plant, and_ they were provided with detailed information and related data rgarding the operation of the lines. Following a review of the proposals submitted by the suppliers, Ian and Shanti decided that Martin had the best bid. Martin quoted a cost of $68.00 for manufacturing and ee ge a ee packing for both the current packaging and marketing's new packaging. The supplier would be responsible for raw ent Th c : aye material and packaging material costs. In addition, Garland would pay $35,000 in tooling costs up front. Martin indicated that it would need six months to ramp up production of Edge- worth Toffee. THE TEAM MEETING As Shanti looked at the information on her laptop that had been collected regarding manufacturing and packing of Edgeworth Toffee, she knew that something had to be done to address the declining margins of the brand as a re- sult of increased production costs. Investing in new equip- ment seemed like an obvious solution; however, the capital investment would be significant and her proposal would need to exceed the company's 10 percent cost of capital rate to get approval by finance, While reviewing the proposal by Martin, Shanti felt that some of the overhead costs at the Durham plant could be elim- inated if production of Edgeworth Toffee was outsourced. The estimate provided by the accounting department was that overhead costs allocated to the brand could be reduced by ap- proximately 30 percent if production was outsourced. Historically, the company's strategy had been to control production of its products to ensure(quality and delivery performance')Garland had an excellent reputa- tion with it customers and the customer service level for Edgeworth Toffee was a line fill rate of Q8 percent.) However, if the case to outsource could be made suc- cessfully to the team on Monday, Shanti felt that senior management would approve the proposal. This was an important decision and she wanted to make a clear rec- ommendation at the meeting on Monday, supported by a thorough analysis of both options
Step by Step Solution
There are 3 Steps involved in it
1 Expert Approved Answer
Step: 1 Unlock
Question Has Been Solved by an Expert!
Get step-by-step solutions from verified subject matter experts
Step: 2 Unlock
Step: 3 Unlock
Students Have Also Explored These Related Accounting Questions!