

Question: Read the annual report and answer the 3 following questions. Word count 200-250 for each question. ARITZIA Aritzia Inc. MANAGEMENT'S DISCUSSION AND ANALYSIS Fiscal Year
Read the annual report and answer the 3 following questions. Word count 200-250 for each question.
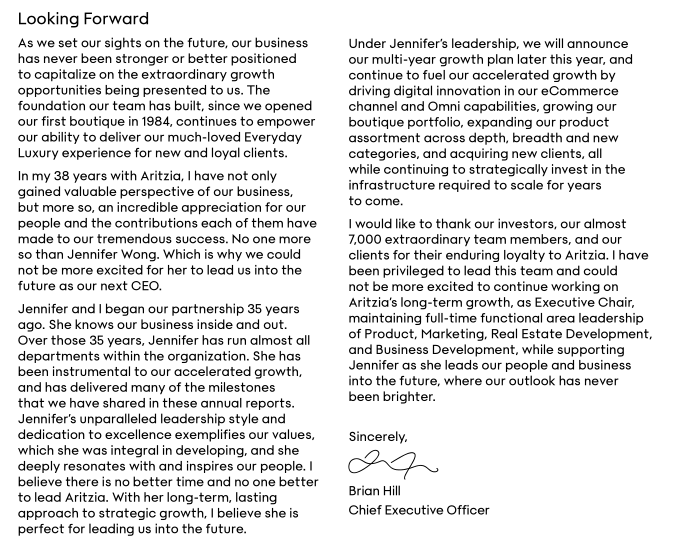
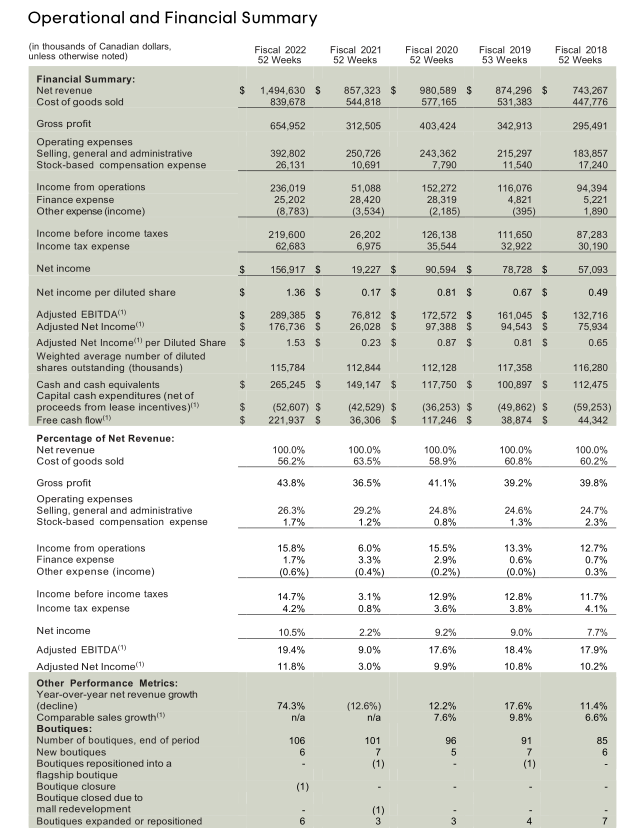
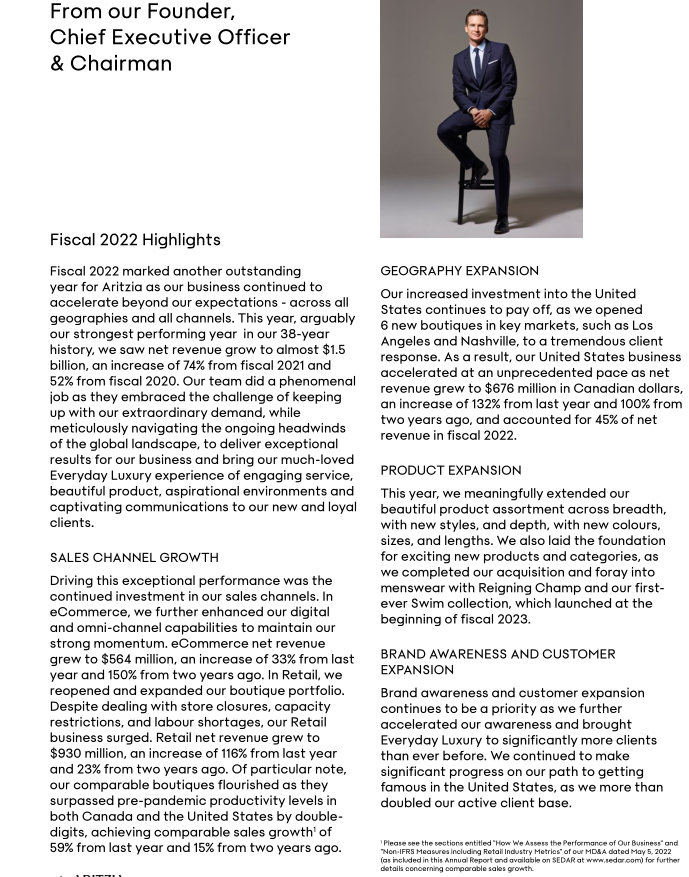
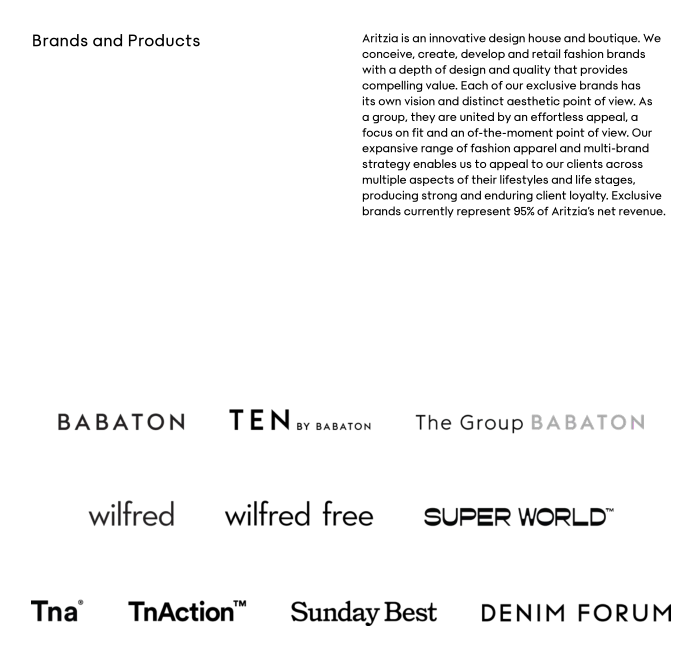
ARITZIA Aritzia Inc. MANAGEMENT'S DISCUSSION AND ANALYSIS Fiscal Year Ended February 27, 2022 May 5, 2022 The following Management's Discussion and Analysis ("MD&A") dated May 5, 2022 is intended to assist readers in understanding the business environment, strategies and performance and risk factors of Aritzia Inc. (together with its consolidated subsidiaries, referred to herein as "Aritzia", the "Company", "we", "us" or "our"). This MD&A provides the reader with a view and analysis, from the perspective of management, of the Company's financial results for the thirteen-week and fifty-two week periods ended February 27, 2022. This MD&A should be read in conjunction with the Company's audited annual consolidated financial statements and accompanying notes Fiscal 2022 (as hereinafter defined). FORWARD-LOOKING INFORMATION Certain statements made in this MD&A may constitute forward-looking information under applicable securities laws. Forward-looking statements are based on information currently available to management and on estimates and assumptions made by management regarding, among other things, general economic and geopolitical conditions and the competitive environment within the retail industry, in light of its experience and perceptions of historical trends, current conditions and expected future developments, as well as other factors that are believed to be appropriate and reasonable in the circumstances. These statements may relate to our future financial outlook, our leadership transition and its impact on our business, people and growth, our plans relating to our distribution facilities and digital infrastructure, and anticipated events or results and include, our ability to sustain momentum in our business and advance our strategic growth drivers, continued focus on driving digital innovation and eCommerce and Omni capabilities, accelerating boutique growth and expanding our product assortment, acquiring new clients and investing in our infrastructure and growing team, the Company's response to mitigate anticipated supply chain disruptions, geopolitical risks, inflationary pressures and labour shortages, repurchases under our normal course issuer bid, our outlook for: (i) net revenue in the first quarter of Fiscal 2023, (ii) net revenue in Fiscal 2023, (iii) gross profit margin in Fiscal 2023, (iv) SG&A as a percent of net revenue in Fiscal 2023, (v) net capital expenditure in Fiscal 2023 and (vi) new boutiques and expansion or repositioning of existing boutiques in Fiscal 2023 . Particularly, information regarding our expectations of future results, targets, performance achievements, prospects or opportunities is forward-looking information. As the context requires, this may include certain targets as disclosed in the prospectus for our initial public offering, which are based on the factors and assumptions, and subject to the risks, as set out therein and herein. Often but not always, forward-looking statements can be identified by the use of forward-looking terminology such as "plans", "targets", "expects" or "does not expect", "is expected", "an opportunity exists", "budget", "scheduled", "estimates", "outlook", "forecasts", "projection", "prospects", "strategy", "intends", "anticipates", "does not anticipate", "believes", or variations of such words and phrases or state that certain actions, events or results "may", "could", "would", "might", "will", "will be taken", "occur" or "be achieved". In addition, any statements that refer to expectations, intentions, projections or other characterizations of future events or circumstances contain forward-looking information. Statements containing forward-looking information are not historical facts but instead represent our expectations, estimates and projections regarding future events or circumstances Implicit in forward-looking statements in respect of the Company's expectations for: (i) net revenue of approximately $375 million for the first quarter of fiscal 2023, representing just over a 50% increase compared to last year, (ii) net revenue of approximately $1.8 billion in Fiscal 2023, representing an increase of approximately 20% from Fiscal 2022, (ii) gross profit margin to decrease by approximately 100 bps compared to last year, (iv) SG&A as a percent of net revenue to increase approximately 50 bps to 100 bps compared to last year and (v) net capital expenditures in the range of $110 million to $120 million, are certain current assumptions including the continued acceleration of sales in the United States both in retail and eCommerce channels as well as continued momentum of the Company's eCommerce business in Canada. The Company's forward-looking information is also based upon assumptions regarding the overall retail environment, the COVID-19 pandemic and related health and safety protocols andLooking Forward As we set our sights on the future. our business has never been stronger or better positioned to capitalize on the errtrt'.rordinor1,.-r growth opportunities being presented to us. The foundation our team has built. since we opened our first boutique in 19311. continues to empower our ability to deliver our much-loved Everyday Luxury experience for new and loyal clients. In my 33 years with Aritzia. l have not only gained valuable perspective of our business. but more so. an incredible appreciation for our people and the contributions each of them have made to our tremendous success. No one more so than Jennifer Wong. Which is 1I'vhy we could not be more excited for her to lead us into the future as our next CED. Jennifer and I began our partnership 35 years ago. She knows our business insideand out. Over those 35 years. Jennifer has run almost all departments within the organization. She has been instrumental to our accelerated growth. and has delivered many of the milestones that we have shared in these annual reports. Jennifer's unparalleled leadership style and dedication to excellence exemplifies our values. which she was integral in developing. and she deeply resonates with and inspires our people. I believe there is no better time and no one better to lead Aritlia. With her long-term. lasting approach to strategic growth. I believe she is perfect for leading us into the future. Under Jennifer's leadership. we will announce our multi-yeor growth plan later this year. and continue to fuel our accelerated growth by driving digital innovation in our eCommerce channel and Omni capo bilities. growing our boutiaue portfolio. expanding our product assortment across depth. breadth and new categories. and acquiring new clients. all while continuing to strategically invest in the infra structure required to scale for years to come. I would like to thank our investors. our almost EDGE! extraordinary team members. and our clients for their enduring loyalty to Aritzia. l have been privileged to lead this team and could not be more excited to continue working on Aritzia's long'term growth. as Executive Chair. maintaining full-time functional area leadership of Product. Marketing. Real Estate Development. and Business Development. while supporting Jennifer as she leads our people and business into the future. where our outlook has never been brighter. Sincerely. M Brian Hill Chief Executive lCilf'cer Operational and Financial Summary in thousands of Canadian dollars. Fiscal 2022 Fiscal 2021 Fiscal 2020 Fiscal 2019 Fiscal 2018 unless otherwise noted) 52 Weeks 52 Weeks 52 Weeks 53 Weeks 52 Weeks Financial Summary: Net revenue $ 1,494,630 $ 857,323 $ 980.589 $ 874,296 $ 743.267 Cost of goods sold 839.678 544,818 577.165 531.383 447,776 Gross profit 654,952 312,505 403,424 342,913 295,491 Operating expenses Selling. general and administrative 392,802 250,726 243.362 215,297 183,857 Stock-based compensation expense 26,131 10,691 7,790 11,540 17,240 Income from operations 236,019 51,088 152.272 116,076 94,394 Finance expense 25,202 28,420 28,319 4.821 5,221 Other expense (income) (8,763) (3,534 (2,185) (395) 1,890 Income before income taxes 219,600 26,202 126,138 111,650 87,283 Income tax expense 62.683 6,975 35.544 32,922 30,190 Net income 156,917 5 19,227 $ 90,594 $ 78,728 $ 57,093 Net income per diluted share 1.36 5 0.17 $ 0.81 $ 0.67 $ 0.49 Adjusted EBITDA!) 289,385 $ 76,812 $ 172.572 $ 161,045 $ 132,716 Adjusted Net Income!?) 176.736 26,028 $ 97,388 94.543 75,934 Adjusted Net Income" per Diluted Share 1.53 0.23 $ 0.87 0.81 0.65 Weighted average number of diluted shares outstanding (thousands) 115,784 112,844 112,128 117,358 116,280 Cash and cash equivalents 265,245 $ 149,147 $ 117,750 $ 100,897 S 112,475 Capital cash expenditures (net of proceeds from lease incentives)(") (52,607) $ (42,529) $ (36,253) $ (49,862) $ (59,253) Free cash flow!!) 221,937 5 36,306 $ 117 246 $ 38,874 S 44,342 Percentage of Net Revenue: Net revenue 100.0% 100.0% 100.0% 100.0% 100.0% Cost of goods sold 56.2% 63.5% 58.9% 60.8% 50.2% Gross profit 43.8% 36.5% 41.1% 39.2% 39.8% Operating expenses Selling, general and administrative 26.3% 29.2% 24.8% 24.6% 24.7% Stock-based compensation expense 1.7% 1.2% 0.8% 1.3% 2.3% Income from operations 15.8% 6.0% 15.5% 13.3% 12.7% Finance expense 1.7% 3.3% 2.9% 0.6% 0.7% Other expense (income) (0.6%) (0.4%) (0.2%) (0.0%) 0.3% Income before income taxes 14.7% 3.1% 12.9% 12.8% 11.7% Income tax expense 4.2% 0.8% 3.6% 3.8% 4.1% Net income 10.5% 2.2% 9.2% 3.0% 7.7% Adjusted EBITDA() 19.4% 9.0% 17.6% 18.4% 17.9% Adjusted Net Income(1) 11.8% 3.0% 9.9% 10.8% 10.2% Other Performance Metrics: Year-over-year net revenue growth (decline) 74.3% (12.6%) 12.2% 17.6% 11.4% Comparable sales growth(") nia 7.6% 9.8% 6.6% Boutiques: Number of boutiques, end of period 106 101 91 35 New boutiques 6 5 7 6 Boutiques repositioned into a (1) (1) anbanoq dysbey Boutique closure (1) Boutique closed due to mall redevelopment (1) Boutiques expanded or repositionedFrom our Founder, Chief Executive Officer & Chairman Fiscal 2022 Highlights Fiscal 2022 marked another outstanding GEOGRAPHY EXPANSION year for Aritzia as our business continued to accelerate beyond our expectations - across all Our increased investment into the United geographies and all channels. This year, arguably States continues to pay off, as we opened our strongest performing year in our 38-year 6 new boutiques in key markets, such as Los history, we saw net revenue grow to almost $1.5 Angeles and Nashville, to a tremendous client billion, an increase of 74% from fiscal 2021 and response. As a result, our United States business 52% from fiscal 2020. Our team did a phenomenal accelerated at an unprecedented pace as net job as they embraced the challenge of keeping revenue grew to $676 million in Canadian dollars, up with our extraordinary demand, while an increase of 132% from last year and 100% from meticulously navigating the ongoing headwinds two years ago, and accounted for 45% of net of the global landscape, to deliver exceptional revenue in fiscal 2022. results for our business and bring our much-loved Everyday Luxury experience of engaging service, PRODUCT EXPANSION beautiful product, aspirational environments and This year, we meaningfully extended our captivating communications to our new and loyal beautiful product assortment across breadth, clients. with new styles, and depth, with new colours, sizes, and lengths. We also laid the foundation SALES CHANNEL GROWTH for exciting new products and categories, as Driving this exceptional performance was the we completed our acquisition and foray into continued investment in our sales channels. In menswear with Reigning Champ and our first- eCommerce, we further enhanced our digital ever Swim collection, which launched at the and omni-channel capabilities to maintain our beginning of fiscal 2023. strong momentum. eCommerce net revenue grew to $564 million, an increase of 33% from last BRAND AWARENESS AND CUSTOMER year and 150% from two years ago. In Retail, we EXPANSION reopened and expanded our boutique portfolio. Brand awareness and customer expansion Despite dealing with store closures, capacity continues to be a priority as we further restrictions, and labour shortages, our Retail accelerated our awareness and brought business surged. Retail net revenue grew to Everyday Luxury to significantly more clients $930 million, an increase of 116% from last year than ever before. We continued to make and 23% from two years ago. Of particular note, significant progress on our path to getting our comparable boutiques flourished as they famous in the United States, as we more than surpassed pre-pandemic productivity levels in doubled our active client base. both Canada and the United States by double- digits, achieving comparable sales growth of 59% from last year and 15% from two years ago. 'Please see the sections entitled "How We Assess the Performance of Our Business" and "Non-IFRS Measures including Retail Industry Metrics" of our MOSA dated May 5, 2022 tos included in this Annual Report and available on SEDAR at www.seder.com) for further details concerning comporable sales growth.Brands and Products Aritzia is an innovative design house and boutique. We conceive, create, develop and retail fashion brands with a depth of design and quality that provides compelling value. Each of our exclusive brands has its own vision and distinct aesthetic point of view. As a group, they are united by an effortless appeal, a focus on fit and an of-the-moment point of view. Our expansive range of fashion apparel and multi-brand strategy enables us to appeal to our clients across multiple aspects of their lifestyles and life stages, producing strong and enduring client loyalty. Exclusive brands currently represent 95% of Aritzia's net revenue. BABATON TEN BY BABATON The Group BABATON wilfred wilfred free SUPER WORLD" Tna' TnAction Sunday Best DENIM FORUMAdjusted Net Income (per Diluted Share) is a useful measure of performance, as we believe it provides a more relevant picture of results by excluding the effects of expenses that are not reflective of underlying business performance and other one-time or non-recurring expenses. We use Adjusted Net Income to facilitate a comparison of our performance on a consistent basis from period-to-period and to provide for a more complete understanding of factors and trends affecting our business. We define Adjusted Net Income as consolidated net income, adjusted for the impact of certain items, including stock-based compensation expense, unrealized gains or losses on equity derivative and forward contracts, fair value adjustment for inventories acquired in CYC, fair value adjustments of NCI in exchangeable shares liability and other non-cash items and/or items that we consider non-recurring and not representative of our ongoing operating performance, net of related tax effects. We define Adjusted Net Income per Diluted Share by dividing Adjusted Net Income by the weighted average number of diluted shares outstanding. Capital cash expenditures (net of proceeds from lease incentives) is a useful measure as we believe it is a more useful indicator of the net cash capital investment relating to our boutiques and infrastructure. We define capital cash expenditures (net of proceeds from lease incentives) as cash used in investing activities, excluding cash used in business combinations, less proceeds from lease incentives. Free cash flow is an important metric because it is an indicator of how much cash is available for business acquisitions, debt repayment, share repurchases and other investing and financing activities. Our sustained ability to generate free cash flow is an indicator of the financial strength of our business, as we require regular capital expenditures to build and maintain boutiques and invest in infrastructure. We define free cash flow as net cash generated from operating activities excluding interest paid on credit facilities, plus proceeds from lease incentives, less repayments of principal on lease liabilities and cash used for the purchase of property, equipment and intangible assets. NON-IFRS MEASURES INCLUDING RETAIL INDUSTRY METRICS This MD&A makes reference to certain non-IFRS measures including certain retail industry metrics. These measures are not recognized measures under IFRS, do not have a standardized meaning prescribed by IFRS and are therefore unlikely to be comparable to similar measures presented by other companies. Rather, these measures are provided as additional information to complement those IFRS measures by providing further understanding of our results of operations from management's perspective. Accordingly, these measures should not be considered in isolation or as a substitute for analysis of our financial information reported under IFRS. We use non-IFRS measures including "EBITDA", "Adjusted EBITDA", "Adjusted Net Income", "Adjusted Net Income per Diluted Share", "capital cash expenditures (net of proceeds from lease incentives)", and "free cash flow." This MD&A also makes reference to gross profit margin" as well as "comparable sales growth", which are commonly used operating metrics in the retail ndustry but may be calculated differently compared to other retailers. Gross profit margin and comparable sales growth are considered supplementary measures under applicable securities laws. Our comparable sales growth calculation excludes the impact of foreign currency fluctuations. These non-IFRS measures, including retail industry metrics, are used to provide investors with supplemental measures of our operating performance and thus highlight trends in our core business that may not otherwise be apparent when relying solely on IFRS measures. We believe hat securities analysts, investors and other interested parties frequently use non-IFRS measures, including retail industry metrics, in the evaluation of issuers. Our management also uses non-IFRS measures, including retail industry metrics, in order to facilitate operating performance comparisons from period to period, to prepare annual operating budgets and forecasts and to determine components of management compensation. For definitions and reconciliations of these non-IFRS measures to the relevant reported measures, please see the "How We Assess the Performance of Our Business" and "Selected Consolidated Financial Information" sections of this MD&A
Step by Step Solution
There are 3 Steps involved in it

Get step-by-step solutions from verified subject matter experts