

Question: Read the article and answer the following questions : - Summarize the method plan of this research? - what are some of the limitations of
Read the article and answer the following questions :
- Summarize the method plan of this research?
- what are some of the limitations of their method (specifically their classification errors ) ?
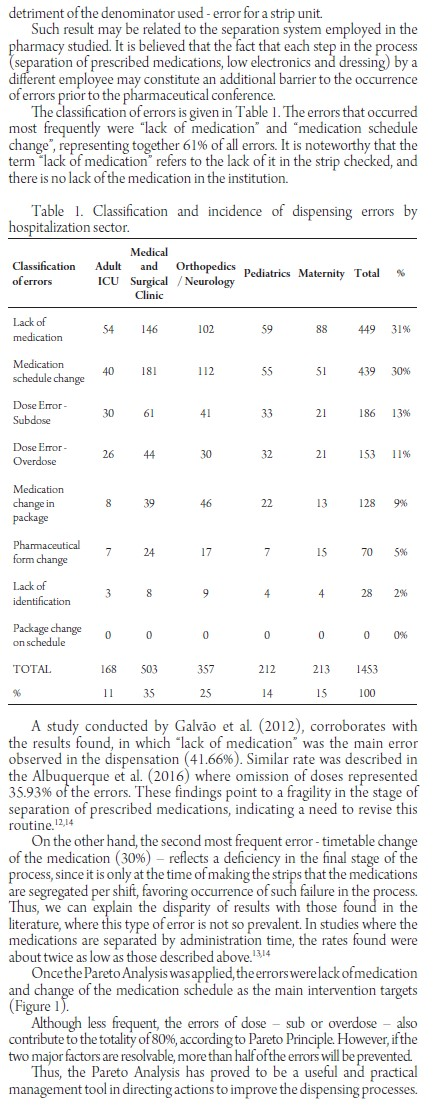
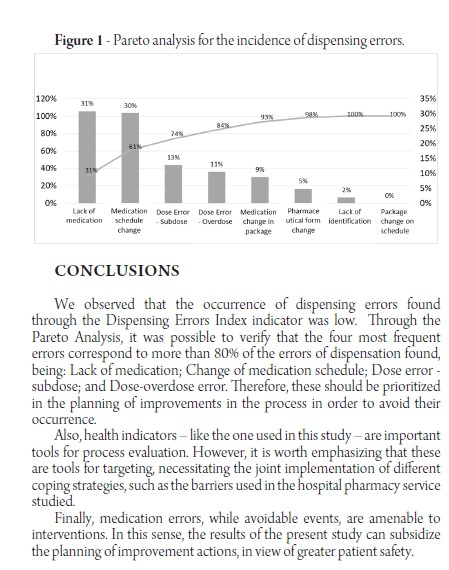
PROFILE AND ANALYSIS OF PARETO OF THE DISPENSING ERRORS OF A PUBLIC HOSPITAL Introduction: Strategies for evaluation and monitoring of processes subsidize coping with medication errors (ME), which constitute a major part of adverse events (AE) in hospital patients. Many studies concern prescribingand administration errors, but few discuss the impacts of dispensing errors. Objective: To describe the profile of dispensing errors and quantify the discrepancies generated by the indicator in a hospital of high complexity. Methods: Transversal and retrospective study of dispensing errors avoided by the pharmacist Once identified, the discrepancies were classified and accounted for, generating an indicator of the work process number of errors avoidedumber of strips dispensed x 100). Subsequently, a Pareto Analysis was performedin order to prioritize problem solving actions. Results: A total of 27,980 prescriptionswere obtained, which originated 48,451 medication strips. The dispensing errors found were 1,453. The dispensing error rate was 3 errors per 100 strips. The errors that occurred most frequently were lack of medication prescribed and change of medication schedule, representing together 61% of all errors. The same errors were identified in the analysis in the Pareto Diagram as the main intervention targets in process improvement. Conclusions: The occurrence of errors found through the indicator "Dispensing Error Index' was considered low,compared to data found in the literature. Through Pareto Analysis, it was possible to identify the most frequent errors, for further planning of improvement actions, in order to increase patient safety. Keywords: Medication errors; patient safety; indicators of health quality. INTRODUCTION medication use. This concept implies that inappropriate use may or may not harm the patient. The National Patient Safety Program Such events may be related to several stages of (Programa Nacional de Segurana do Paciente, health care, including prescription, dispensing PNSD) was established in Brazil in 2013 with the administration..10 aim of promoting safe practices in health facilities. However, most of the research concerns Through the establishment of protocols, this aims to prescribing errors and administration," while few ensure patient safety by inserting new strategies for studies are published on dispensing errors in Brazil improving health care. and in the world. Among the protocols established by the PNSP In addition, it is relevant to identify the category is the "Safety Protocol on Prescription and Use and of ME, as well as its determinants, in order to direct Administration of Medicines, with the purpose of coping strategies to prevent them? establishing measures that minimize the occurrence The objective of the present study was to describe of medication errors at all stages of the therapeutic the profile of dispensing errors in a pharmacy of a chain. Medication errors (ME) constitute a major tertiary hospital in the State of Paran, by quantifying part of adverse events (AE) in hospital patients and classifying them by the error rate indicator in the A systematic review published in 2008 evidenced pre-dispensing medication conference and through the magnitude of errors associated with medication Pareto analysis, subsidize management actions to in the context of AE, constituting the second most improve processes. prevalent type among the events listed by the research. In addition to the potential harm to the METHODS individual, additional treatment costs should also be considered as a result of an increase in length of This is a cross-sectional and retrospective study hospital stay and possible complications. of dispensing errors that were avoided through the In this sense, the establishment of strategies for institution of the medication strip conference by the evaluation and monitoring of processes subsidizes hospital pharmacist. coping with potential errors related to medications. The study was carried out in a Public Hospital in Among the tools recommended by the Ministry the west of Paran at the tertiary level, with care only of Health are health indicators, defined as data or SUS and capacity for 195 beds, financed by the State numerical information that quantify, among other and Federal Government variables, the performance of processes and the The Pharmacy Service of the present study organization as a whole. registers as errors of dispensing the deviations MS can be defined as any preventable event that occur during the separation, low electronics, that, in fact or potentially, can lead to inappropriate preparation of strips and dispensing of medicines, The pharmaceutical service of the present institution begins with the analysis of the prescriptions followed by the separation of the prescription medications, low electronics and confection of the strips. The distribution system is of the individualized type, in which strips are provided per period, for each patient. The prescriptions are valid for 24 hours, thus generating three strips: moming afternoon and night, these being made concomitantly. The strip conference was deployed at the hospital's pharmacy service in 2012. Before dispensing to the nursing team, the morning and evening shifts of the following hospitalization sectors are checked by the pharmacist: Medical and Surgical Clinic, Matemity; Pediatrics; Adult Intensive Care Unit (ICU); and Orthopedics and Neurology. The strips dispensed in the afternoon shift were not counted in the present study, since, due to the logistics of the service, they do not go through the pharmacist's conference. During the conference process, the pharmacist assesses possible discrepancies between the strip, previously made by the hospital pharmacy service, and the corresponding prescription. Once identified, the discrepancies are classified according to their category, in order to generate an indicator of the work process. Since the conference was implemented as an additional barrier to medication errors, the observed inconsistencies are forwarded to the correction and subsequently waived. The Indicator of the present study was denominated "Index of Dispensations Errors. The numerator of the indicator formula consists of the total number of errors identified during the conference, while the denominator is represented by the total number of strips made. The result obtained is expressed in the power of ten, generating an Error/Strip index. The methodology for categorizing errors was based on the classification according to The National Coordinating Council for Medication ErrorReporting and Prevention (NCCMERP) being adapted to the local reality. Based on this, errors of dispensation were considered: lack of identification of the patient; exchange of medication; lack of medication; dose error - overdose or subdose; exchange of hours and exchange of pharmaceutical form. As for the statistical technique used, the Pareto Diagram was applied in order to guide decision making. This allows you to select and prioritize a small number of factors that have a major impact on process improvement The Pareto Principle is based on the idea that 80% of the results correspond to only 20% of the factors, justifying the prioritization. The data originated between the period from January 1 to December 31, 2015 were analyzed. Tabulation and statistical analysis were performed in Microsoft Excel 2013 Software. The errors were classified according to their category and assessed for frequency distribution. Subsequently, a Pareto Analysis was performed in order to prioritize actions for problem solving. The study was approved by the Research Ethics Committee (REC), under opinion No. 1,872,685. RESULTS AND DISCUSSION A total of 27,980 prescriptions were obtained, which originated 48,451 medication strips during the study periodThe dispensing errors encountered during the conference of the strips by the pharmacist amounted to 1,453. The dispensing error rate was 3 errors per 100 strips. For the discussion, it is important to consider that, although research on dispensing errors in Brazil has been gaining ground in recent years, literature on the subject is still scarce. Therefore, the comparison between the results should be cautious, since there is a great divergence in the applied methodologies and in the expression of the results. In addition, it is worth emphasizing the difference between the scenarios and pharmaceutical services already studied, which further complicates the context of comparison To date, no studies using a methodology like the present study (indicator expressed in index) have been identified, since the construction of the indicator was based on the local reality - where the number of errors per strip is calculated, not the number of errors due to dispensed medications - making their expression unfeasible.712,13 Although they could not be compared directly, in a hypothetical conversion, the rate found (3%) would be much lower than the literature reports, considering that the denominator would increase exponentially if the number of medications contained in each strip were considered in detriment of the denominator used- error for a strip unit. Such result may be related to the separation system employed in the pharmacy studied. It is believed that the fact that each step in the process separation of prescribed medications, low electronics and dressing) by a different employee may constitute an additional barrier to the occurrence of errors prior to the pharmaceutical conference The classification of errors is given in Table 1. The errors that occurred most frequently were "lack of medication" and "medication schedule change", representing together 61% of all errors. It is noteworthy that the term lack of medication refers to the lack of it in the strip checked, and there is no lack of the medication in the institution. Table 1. Classification and incidence of dispensing errors by hospitalization sector. Classification of errors Adult ICU Medical and Orthopedics Pediatrics Maternity Surgical Neurology Clinic Total Lack of S4 146 10259 88 449 medication 31% Medication schedule change 40 to 30% Dose Error- Subdose Dose Error Overdose 26 44 21 Medication change in package 13 128 9% Pharmaceutical form change 7 70 5% Lack of identification Package change on schedule 0 0 0 0 0 0% TOTAL 168 11 503 35 357 25 212 14 213 15 1453 100 A study conducted by Galvo et al. (2012), corroborates with the results found, in which lack of medication was the main error observed in the dispensation (41.66%). Similar rate was described in the Albuquerque et al. (2016) where omission of doses represented 35.93% of the errors. These findings point to a fragility in the stage of separation of prescribed medications, indicating a need to revise this routine 12,14 On the other hand, the second most frequent error - timetable change of the medication (30%) - reflects a deficiency in the final stage of the process, since it is only at the time of making the strips that the medications are segregated per shift, favoring occurrence of such failure in the process. Thus, we can explain the disparity of results with those found in the literature, where this type of error is not so prevalent. In studies where the medications are separated by administration time, the rates found were about twice as low as those described above. 13,14 Once the Pareto Analysis was applied, the errors were lack ofmedication and change of the medication schedule as the main intervention targets (Figure 1). Although less frequent, the errors of dose - sub or overdose - also contribute to the totality of 80%, according to Pareto Principle. However, if the two major factors are resolvable, more than half of the errors will be prevented. Thus, the Pareto Analysis has proved to be a useful and practical management tool in directing actions to improve the dispensing processes. Figure 1 - Pareto analysis for the incidence of dispensing errors. 120% 100% 80% 20% 60% 15% 40% 0% Lack of medication Medication schedule change Dose Error Dose Error Medication Subdose Overdose change in package Pharmace utical form change lack of identification Package change on schedule CONCLUSIONS We observed that the occurrence of dispensing errors found through the Dispensing Errors Index indicator was low. Through the Pareto Analysis, it was possible to verify that the four most frequent errors correspond to more than 80% of the errors of dispensation found, being: Lack of medication; Change of medication schedule; Dose error subdose; and Dose-overdose error. Therefore, these should be prioritized in the planning of improvements in the process in order to avoid their occurrence. Also, health indicators - like the one used in this study - are important tools for process evaluation. However, it is worth emphasizing that these are tools for targeting, necessitating the joint implementation of different coping strategies, such as the barriers used in the hospital pharmacy service studied. Finally, medication errors, while avoidable events, are amenable to interventions. In this sense, the results of the present study can subsidize the planning of improvement actions, in view of greater patient safetyStep by Step Solution
There are 3 Steps involved in it
1 Expert Approved Answer
Step: 1 Unlock

Question Has Been Solved by an Expert!
Get step-by-step solutions from verified subject matter experts
Step: 2 Unlock
Step: 3 Unlock