Question: Read the attached article below then answer the following questions: What observations about statistical process control can you make after reading the article? How important
Read the attached article below then answer the following questions:
What observations about statistical process control can you make after reading the article?
How important is implementing corrective action techniques in maintaining an efficient SPC system?
One of the significant difficulties in advancing healthcare quality is the lack of specificity in defining healthcare processes, establishing performance standards, and measuring compliance with standards after they are defined. Explain how the use of SPC can help solve these issues.

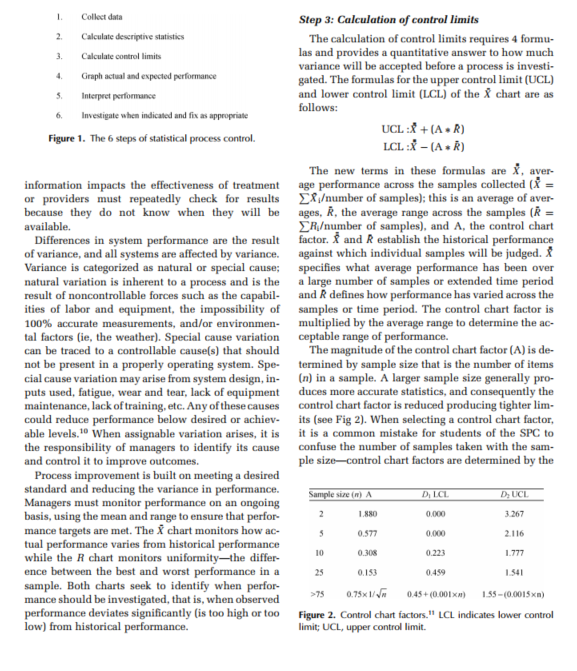
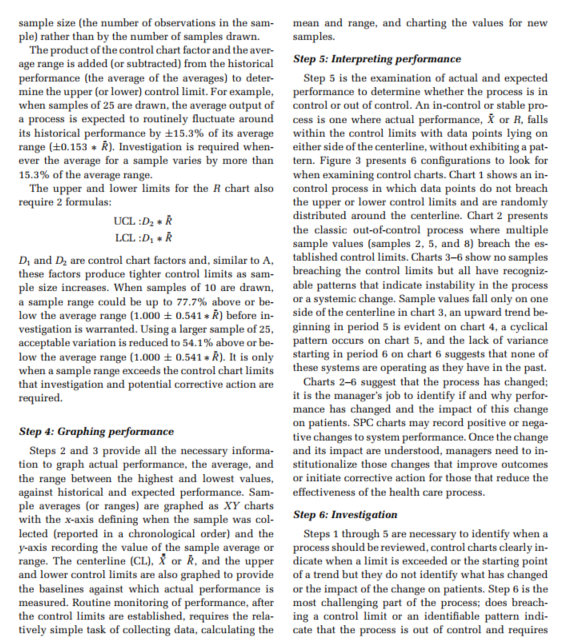
A Statistical Process Control Case Study Thomas K. Ross, PhD Statisfical process control (SPC) charts ne of Edward Deming's quality princican be applied to a wide number of health ples is to make quality everyone's job. 1 care applications, yet widespread use has not Health care organizations have always asoccurred. The greatest obsfacle preventing sumed that quality is everyone's job and wider use is the lack of quality management everyone knows the difference between quality care training that health care workers receive. The and substandard care. Yet health care by relying on technical nature of the SPC guaruntees that individualistic definitions of quality without perforwithout explicit instruction this technique mance evaluation systems has never made quality will not come into widespread use. Peviews everyone's job. Consequently. quality management is left to quality improvement director, department, of health care quality management texts and/or committee, fails to achieve widespread supinform the reader that SPC charts should be port in the organization, and produces fow tangible used to improve delivery processes and improvements in processes or outcomes. outcomes offen without discussing how they Implementing Deming's principle requires emare created. Conversely, medical research ployees to understand what quality is, be capable of frequently reports the improved outcomes identifying substandard performance, and have the achiened after analyzing SPC charts. This authority to make changes that will improve perforarticle is targeted befween these 2 positions: mance. According to Deming, it is the responsibility it reviews the SPC technique and presents a of management to suffuse this quality focus into their tool and data so readers can construct SPC organizations. Of course, this is the problem in health charts. After fackling the case, it is hoped care; other industries have developed rigorous systhat the readers will collect their own data tems to monitor quality and modify processes when and apply the same technique to improve output does not meet expectations. Berwick bluntly processes in their own organization. addressed this problem; doctors, nurses, receptionists, and other health care workers are not trained in or capable of changing how they work, 2 Health care has been implementing quality improvement programs for decades but efforts to cross into the fertile fields of quality management always seem to flounder. The inability to apply the quality management techniques of other industries is due to the more complex nature of health care but part of the problem is the way health care has approached quality management. Berwick recognizes that health From the Department of Health Services and Informantion Manggement, School of Allied Health Sciences, East Carolina Vniversily, Greeaville, NC Corresponding author: Thomas K. Ross, PhD, Department of Health Services and Information Management, School of Keywords: case study, control charts, quality Allied Health Sciences, East Carolina University, 600 Moye management, 5PC statistical process control Bivd, Greemille, NC a76ss (e-mail: rosstheecu. adu) care workers have not been given the tools to sys- of quality management tools. Without understandtematically incorporate quality measurement in their ing quality management techniques and the ends to work. which they can be applied, it is understandable that The following case was developed to demonstrate health care providers would think these tools have how statistical process control (SPC) can be applied little to offer them. to health care processes. The SPC is a tool that de- Health care quality management texts inform the fines what quality is, how performance is measured, reader that SPC charts should be used to improve and when investigation and possibly correction must delivery processes and outcomes often without disoccur. The SPC, once understood, empowers the doc- cussing how they are created. Conversely, medical tor, nurse, department manager, and other health research frequently reports the improved outcomes care workers to enter into the quality management achieved after analyzing SPC charts. This article is process on a more equal basis with those trained targeted between these 2 positions: it reviews the SPC in quality management techniques. The initial audi- technique and presents a tool and an application so ence for this article is health care managers, but as readers can learn how to construct SPC charts and Deming and Berwick note, improvement occurs only offers suggestions as to when they can be used to imwhen all employees understand and embrace these prove health care delivery processes. quality improvement techniques. Getting managers A case study is developed and followed to conand opinion leaders on board is only the first step clusion to demonstrate one potential application of to institutionalizing quality practices throughout the the SPC to health care. The intent is to provide the organization. readers with a basic understanding of how to build This article does not assume that the reader is SPC charts and encourage them to access and analyze versed in statistics or quality management tech- the case data using Excel to evaluate performance on niques, it does however assume familiarity with their own. The case question is: are medicines despreadsheet software. The goal is to demonstrate that livered in a timely manner to maximize medical efquality improvement techniques can be used produc- fectiveness and patient comfort? The control charts tively by all health care workers. At the end of this developed are used to draw conclusions regarding case it is hoped that the reader will be able to identify the operation of the system, explore potential reaa use for the SPC in their area of responsibility, create sons for the performance observed, and speculate SPC charts using Excel, and interpret these charts to on system changes that could improve the timeliimprove outcomes. ness of medicine delivery. After working through the case, it is hoped that the reader will be motivated QUALITY IMPROVEMENT IN to apply the principles and techniques to their own HEALTH CARE work. One of the major difficulties in advancing health One of the greatest obstacles to quality improve- care quality is the lack of specificity in defining health ment in health care is the belief of providers that care processes, establishing performance standards, quality management tools developed in other indus- and measuring compliance with standards after they tries are not relevant to health care services. Not only are defined. Attempts to improve operations and outare the initiatives of other industries deemed irrele- comes are difficult if not impossible when standards vant to health care, many providers hold that quality and measures are ill-defined or absent. Efforts to deimprovement mechanisms developed in other health fine medical processes continue to be hotly debated, care organizations are not applicable to the institu- and opponents argue that there is too much variation tion they work in. This belief is the direct result of the in medical practice to establish one way of treating second factor, and health care providers are not famil- patients and dictating to physicians will not improve iar with the purpose, operation, and interpretation patient care and may hurt patients. 3 On the other hand, countless research has been The SPC is a broader approach that continuously done to define proper medical practice; much of this examines processes to identify undesirable trends in work is amendable to and should be tracked by the performance and institute corrective action before SPC to improve health care outcomes for patients. harm arises. Fasting and Gisvold used the SPC in McGlynn et al found that patients received 54.9% of anesthesia to study a range of adverse events that are recommended care, more important than their con- less severe and more frequent than sentinel events clusion was their technical supplement that provided that contained the potential for harm. As a result the indicators of what should occur and when it of their study, they were able to reduce anesthesia should occur for 30 conditions. 4 accidents. 6 The SPCcomplements root cause analysis Other industries recognize that poor performance and extends process improvement efforts by adding is the result of variation, that is, deviations from how ongoing monitoring of a broad range of events to qualthings should be done that adversely impact out- ity management. JCAHO (LD.5.2) notes that sentinel comes. Controlling variation is the key to process event analysis is reactive and does not meet the intent improvement. Health care providers are arguably of the JCAHO patient safety standard. 7 The SPC is not saddled with more sources of variation than pro- concerned with particular cases but rather with the ducers of other goods and services but the issue re- ongoing function of systems and thus is a proactive mains; is there too much variation in treatment and approach to operations that monitors performance to will a more systematic approach to health care de- detect changes in system performance before problivery processes improve outcomes? The SPC is a lems arise. tool health care workers can use to determine when variation is a routine part of patient care, neces- The 6 steps of SPC sary and beneficial for patients and the health care The goal of the SPC as envisioned by Walter system, and when variation is excessive and poten- Shewhart is to determine when a system is out of contially harmful. Armed with this information, it is the trol and requires adjustment to improve its output. duty of health care providers to reduce inappropriate An in-control system simply indicates that it is opervariation. ating close to its historical performance; this perforIMPROVINGHEALTHCAREstandardsorcustomerexpectations.Asystemthatmance,however,mayfailtomeetgenerallyaccepted Root cause analysis or routine monitoring? is out of control indicates performance that is significantly different from historical performance. The deviates sufficiently to endanger quality and improve tion of an adverse event with the goal of reducing in-control performance to improve outcomes. harm to patients by preventing the reoccurrence of Shewhart's second goal was to devise a quality the event. JCAHO-accredited health care organiza- monitoring and improvement system that could be tions must conduct a root cause analysis focusing operated effectively by workers whose expertise lies on systems and processes when a sentinel event oc- in areas other than statistics. 8 Such a system required curs. Root cause analysis is limited by its initiating clear signals to indicate when system performance cause; it is undertaken after an adverse event has oc- fluctuates too much and be easy to use. Shewhart crecurred and examines only those processes that were ated his system in a manufacturing environment for part of the care episode. In arguing for a broader ap- those trained in engineering and, as will be demonproach it has been noted "when multiple sources of strated, it is as applicable for service industries and variation are present, isolated observations provide those trained in medical sciences. The SPC is deinsufficient information on which to base objective signed for ease of use; the technique can be described decision making. "" and completed in 6 steps. The SPC can be used to monitor the behavior of tem is operating, the first statistic is the mean. The any system that produces outputs that can be mea- mean is the measure of central tendency and resured numerically. The SPC can monitor the percent- ports "average" performance. The mean is used to age of defects in a sample ( P charts), the number of de- determine whether performance meets the desired fects in a sample (c charts), or output characteristics standard. The mean for a sample is calculated as (average and variance, X^ and R charts) among other follows: X^=xi, the sum of the sampled obthings. These applications require employees to rou- servations divided by the sample size. If Excel is tinely collect simple performance measures to moni- used to record data, the mean is calculated as foltor quality: percent defective, number of defects, the lows: =AVERAGE(range of observations). In medicaaverage weight or length of a product, time required tion management the mean can be used to determine to deliver a product or service, and the variance in whether patients received the specified dose-larger these characteristics. The case uses X^ and R charts or smaller dosage is a problem. Likewise, science and since the concern is the interval between prescribed common sense dictate that the most effective intermedication time and the actual delivery of medicines ventions are delivered proximate to a medical event; to patients. An earlier article in this journal provides the case seeks to determine whether medicine is dea concise explanation of when the different control livered to patients within (plus or minus) 2 hours of charts should be used. 9 the prescribed time. Data collection is the most time consuming part of est value in the sample minus the lowest value and the SPC process. A manager wanting to assess per- is used to assess the variability in performance. Exformance using the SPC must determine the desired cel can be directed to scan a series of numbers and sample size, how often samples are to be drawn, identify the maximum and minimum values and perprocedures to ensure that the samples are random, form the subtraction by the command: =MAX(range and who is responsible for data collection. Managers of observations)-MIN(range of observations). must realize that they face a trade-off between the The need for both statistics is demonstrated by cost of collecting data (sample size and sampling fre- assuming that the average turnaround time for a laboquency) and the accuracy of information obtained ratory test is 60 minutes. Those awaiting results prefrom the collected data. Larger samples typically pro- fer a process in which 50% of tests are available duce more accurate information but are more costly in 65 minutes and the remaining 50% in 55 minand time consuming to collect. The events sampled utes to a process where one half of results are availmust be randomly drawn to ensure that the sample able in 10 minutes and the other half take 110min is not biased; that is, the information gained from utes. Average turnaround time, X, for each process is the sample must be representative of the larger pop- 60 minutes but the first process has a 10-minute range ulation for it to accurately assess the performance of (65-55 minutes) while the second has a 100-minute the nonsampled phenomena. The procedures and re- range (110-10 minutes). Lack of predictability in the sponsibility for data collection should ensure that the second process is a problem. The person awaiting redata collector has no incentive to collect either favor- sults from the second process does not know whether able or nonfavorable performance. After the data are he or she will receive them quickly or have to wait collected, it should be recorded in a spreadsheet. almost 2 hours. Processes with the narrowest range Step 2: Calculation of descriptive statistics_ are generally superior; the process with a 10-minute After the data a provides users with a clear idea of when reAfter the data are recorded, descriptive statistics sults will be available and allows them to schedule must be calculated. Descriptive statistics provide the work accordingly. The variance in the second process information necessary to understand how the sys- can lead to inefficiency if delays in the availability of 1. Colloct data Step 3: Calculation of control limits 2. Calculate descriptive statistics The calculation of control limits requires 4 formu- 3. Calculate control limits las and provides a quantitative answer to how much 4. Graph actual and expected performance variance will be accepted before a process is investigated. The formulas for the upper control limit (UCL) 5. Interpect perforrance and lower control limit (LCL) of the X chart are as 6. Investigate when indicated and fix as appropriate follows: Figure 1. The 6 steps of statistical process control. UCL:X^+(AR)LCL:X(AR~) The new terms in these formulas are X, averinformation impacts the effectiveness of treatment age performance across the samples collected (X^= or providers must repeatedly check for results X1/ number of samples); this is an average of averbecause they do not know when they will be ages, R~, the average range across the samples (R~= available. R4/ number of samples), and A, the control chart Differences in system performance are the result factor. X and R establish the historical performance of variance, and all systems are affected by variance. against which individual samples will be judged. X^ Variance is categorized as natural or special cause; specifies what average performance has been over natural variation is inherent to a process and is the a large number of samples or extended time period result of noncontrollable forces such as the capabil- and R defines how performance has varied across the ities of labor and equipment, the impossibility of samples or time period. The control chart factor is 100% accurate measurements, and/or environmen- multiplied by the average range to determine the actal factors (ie, the weather). Special cause variation ceptable range of performance. can be traced to a controllable cause(s) that should The magnitude of the control chart factor (A) is denot be present in a properly operating system. Spe- termined by sample size that is the number of items cial cause variation may arise from system design, in- (n) in a sample. A larger sample size generally proputs used, fatigue, wear and tear, lack of equipment duces more accurate statistics, and consequently the maintenance, lack of training, etc. Any of these causes control chart factor is reduced producing tighter limcould reduce performance below desired or achiev- its (see Fig 2). When selecting a control chart factor, able levels. 10 When assignable variation arises, it is it is a common mistake for students of the SPC to the responsibility of managers to identify its cause confuse the number of samples taken with the samand control it to improve outcomes. ple size-control chart factors are determined by the Process improvement is built on meeting a desired standard and reducing the variance in performance. Managers must monitor performance on an ongoing basis, using the mean and range to ensure that performance targets are met. The X~ chart monitors how actual performance varies from historical performance while the R chart monitors uniformity-the difference between the best and worst performance in a sample. Both charts seek to identify when performance should be investigated, that is, when observed performance deviates significantly (is too high or too Figure 2. Control chart factors." LCL indicates lower control low) from historical performance. limit; UCL, upper control limit. sample size (the number of observations in the sam- mean and range, and charting the values for new ple) rather than by the number of samples drawn. samples. The product of the control chart factor and the average range is added (or subtracted) from the historical Step 5: Interpreting performance performance (the average of the averages) to deter- Step 5 is the examination of actual and expected mine the upper (or lower) control limit. For example, performance to determine whether the process is in when samples of 25 are drawn, the average output of control or out of control. An in-control or stable proa process is expected to routinely fluctuate around cess is one where actual performance, X or R, falls its historical performance by 15.3% of its average within the control limits with data points lying on range (0.153R~). Investigation is required when- either side of the centerline, without exhibiting a patever the average for a sample varies by more than tern. Figure 3 presents 6 configurations to look for 15.3\% of the average range. when examining control charts. Chart 1 shows an inThe upper and lower limits for the R chart also control process in which data points do not breach require 2 formulas: UCL : D2R distributed around the centerline. Chart 2 presents LCL : D1R the classic out-of-control process where multiple sample values (samples 2,5, and 8) breach the esD1 and D2 are control chart factors and, similar to A, tablished control limits. Charts 3-6 show no samples these factors produce tighter control limits as sam- breaching the control limits but all have recognizple size increases. When samples of 10 are drawn, able patterns that indicate instability in the process a sample range could be up to 77.7% above or be- or a systemic change. Sample values fall only on one low the average range (1.0000.541R~) before in- side of the centerline in chart 3 , an upward trend bevestigation is warranted. Using a larger sample of 25, ginning in period 5 is evident on chart 4 , a cyclical acceptable variation is reduced to 54.1% above or be- pattern occurs on chart 5 , and the lack of variance low the average range (1.0000.541R). It is only starting in period 6 on chart 6 suggests that none of when a sample range exceeds the control chart limits these systems are operating as they have in the past. that investigation and potential corrective action are Charts 2-6 suggest that the process has changed; required. it is the manager's job to identify if and why performance has changed and the impact of this change Step 4: Graphing performance on patients. SPC charts may record positive or negaSteps 2 and 3 provide all the necessary informa- _ and its impact are understood, managers need to intion to graph actual performance, the average, and stitutionalize those changes that improve outcomes the range between the highest and lowest values, or initiate corrective action for those that reduce the against historical and expected performance. Sam- effectiveness of the health care process. ple averages (or ranges) are graphed as XY charts with the x-axis defining when the sample was col- Step 6: Investigation lected (reported in a chronological order) and the Steps 1 through 5 are necessary to identify when a y-axis recording the value of the sample average or process should be reviewed, control charts clearly inrange. The centerline (CL), x or R, and the upper dicate when a limit is exceeded or the starting point and lower control limits are also graphed to provide of a trend but they do not identify what has changed the baselines against which actual performance is or the impact of the change on patients. Step 6 is the measured. Routine monitoring of performance, after most challenging part of the process; does breachthe control limits are established, requires the rela- ing a control limit or an identifiable pattern inditively simple task of collecting data, calculating the cate that the process is out of control and requires


