

Question: Read the background information, then complete the worksheet by filling in all blank cells. Background: The benefits of humor for general well - beling have
Read the background information, then complete the worksheet by filling in all blank cells.
Background: The benefits of humor for general wellbeling have long been touted. Past empirical research has suggested that some of these benefits also exist in the work domain. However, there is little shared understanding as to the role of humor in the workplace. The purpose of this research was to evaluate whether positive humor displayed by a supervisorleader in the workplace affects their effectiveness as a leader.
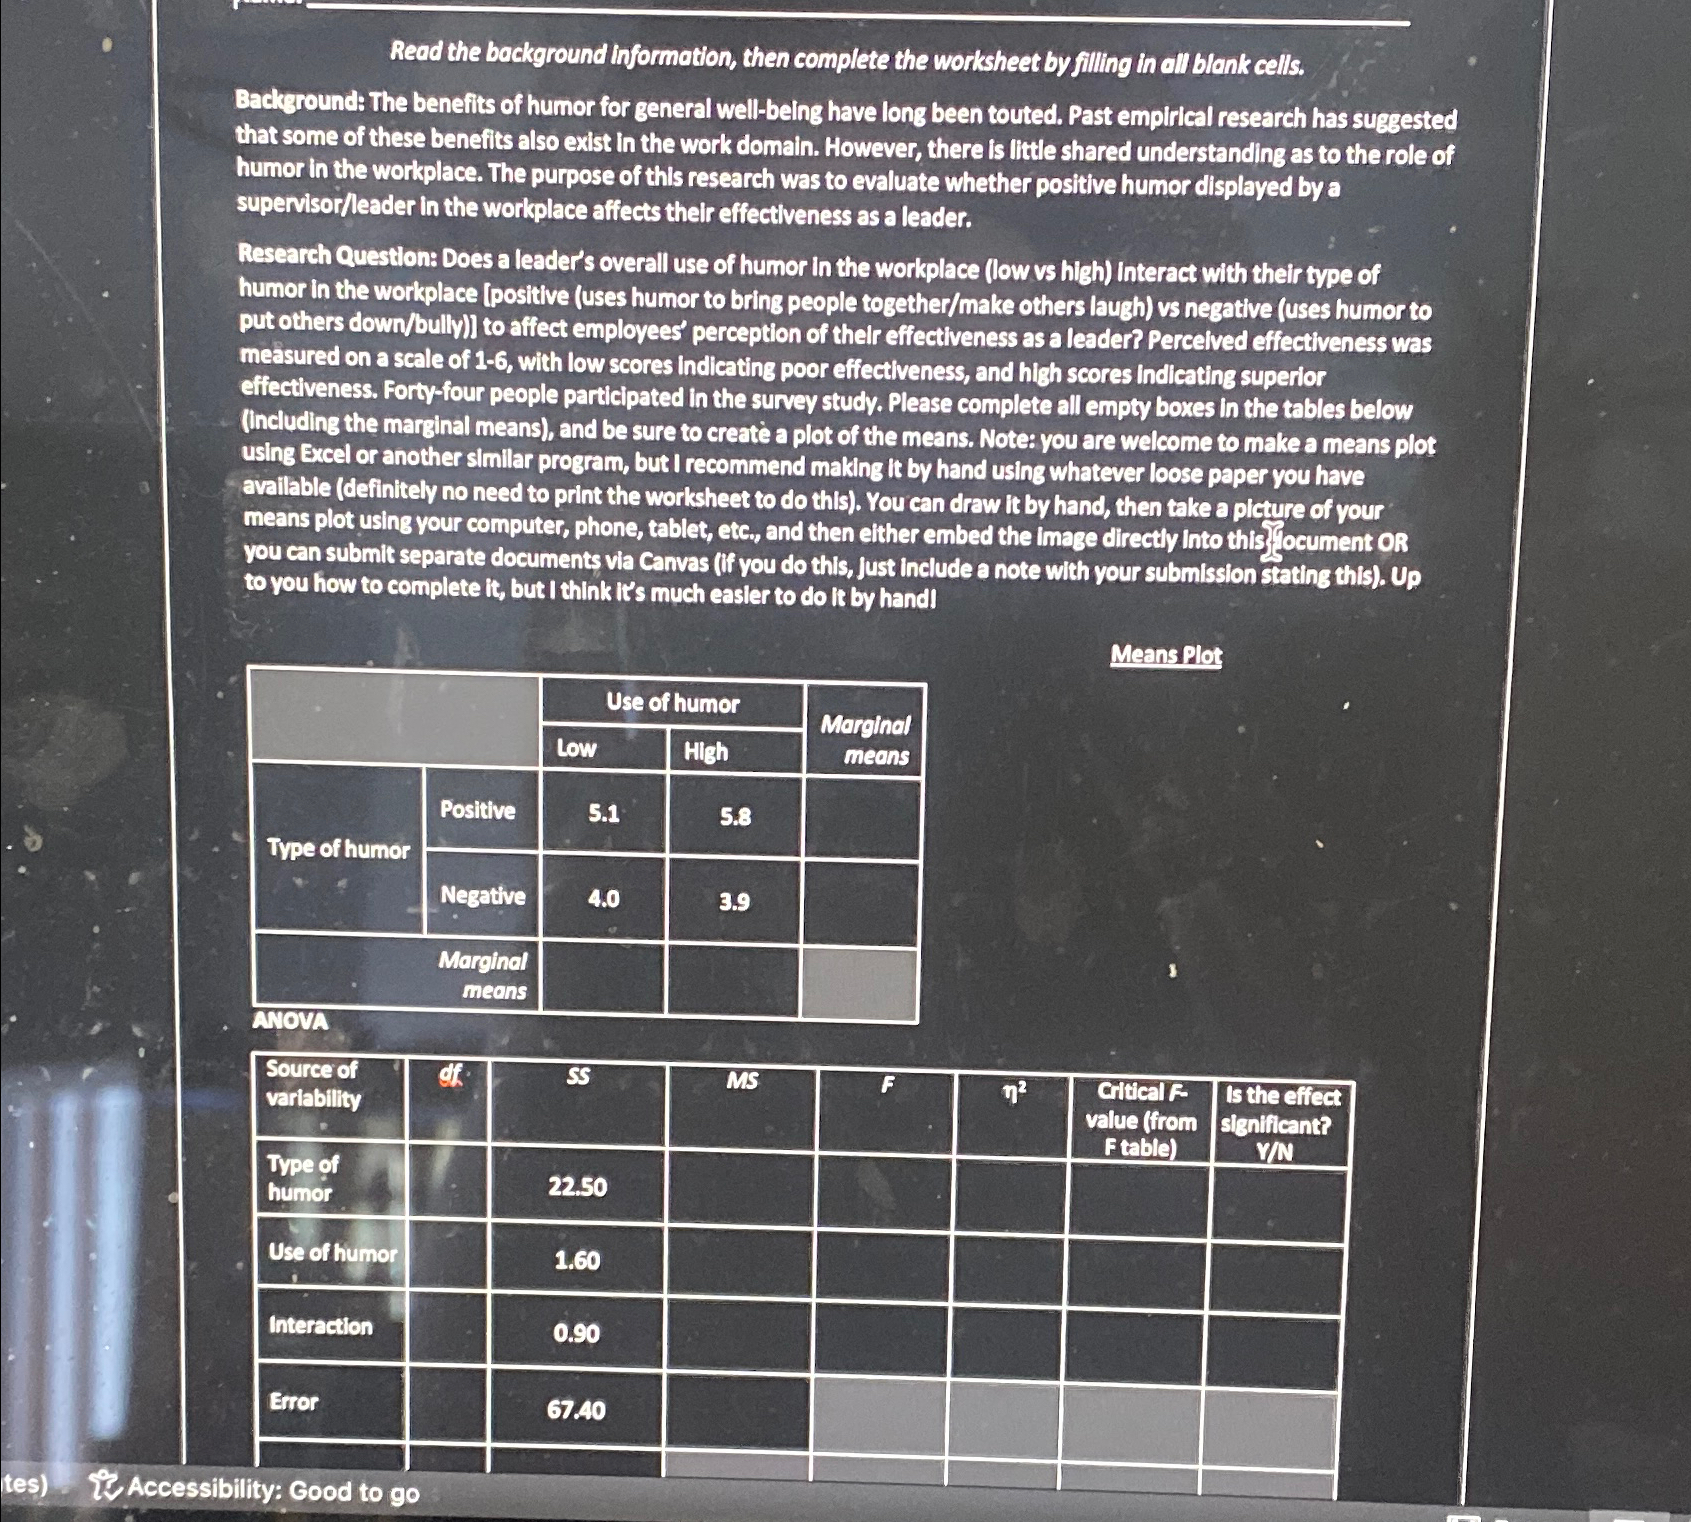
Research Question: Does a leader's overall use of humor in the workplace low vs high Interact with their type of humor in the workplace positive uses humor to bring people togethermake others laugh vs negative uses humor to put others downbully to affect emplovees' perception of thelr effectiveness as a leader? Percelved effectiveness was measured on a scale of with low scores indicating poor effectiveness, and high scores indicating superior effectiveness. Fortyfour people participated in the survey study. Please complete all empty boxes in the tables below Including the marginal means and be sure to create a plot of the means. Note: you are welcome to make a means plot using Excel or another similar program, but I recommend making it by hand using whatever loose paper you have available definitely no need to print the worksheet to do this You can draw it by hand, then take a pleture of your means plot using your computer, phone, tablet, etc., and then either embed the Image directly into this ff ocument OB you can submit separate documents via Canvas ff you do this, just include a note with your submission stating this Up to you how to complete it but I think it's much easier to do it by handi
Means Plot
tableUse of humor,tableMarginalmeansLow,High,Type of humor,Positive,NegativetableMarginalmeans
s
tabletableSource ofvariabilitydfSSMSFtableGitical Fvalue fromF tabletableIs the eficetsignificantYMtableType ofhumorUse of humor,,InteractionError
Step by Step Solution
There are 3 Steps involved in it
1 Expert Approved Answer
Step: 1 Unlock

Question Has Been Solved by an Expert!
Get step-by-step solutions from verified subject matter experts
Step: 2 Unlock
Step: 3 Unlock