

Question: Read the case entitled Forecasting provides a competitive advantage for Disney given below as a PDF attachment (Click on the PDF attachment and it will
Read the case entitled Forecasting provides a competitive advantage for Disney given below as a PDF attachment (Click on the PDF attachment and it will open in Adobe reader) and Answer the following questions:
1. What are the differences between goods and services and provide examples from the case (and Disney theme parks as a whole).
2. There are ten decision areas in Operations management. Discuss each of these ten areas briefly AND provide an example from Disney in general for goods and services for each one of the ten decision areas.
3. Discuss the three broad ways in which companies can achieve a competitive advantage.
4. Explain briefly how Disney achieves its competitive advantage and provide some examples?
5. Discuss the different forecasting time horizons AND when it is used.
6. How does Disney use forecasting to provide good service?
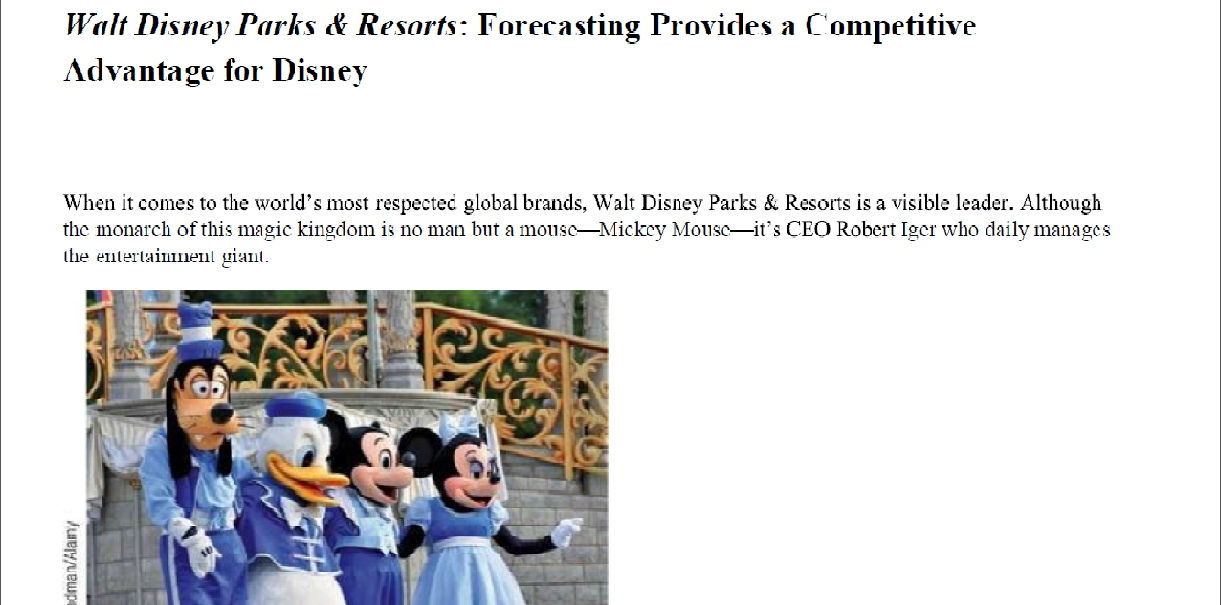
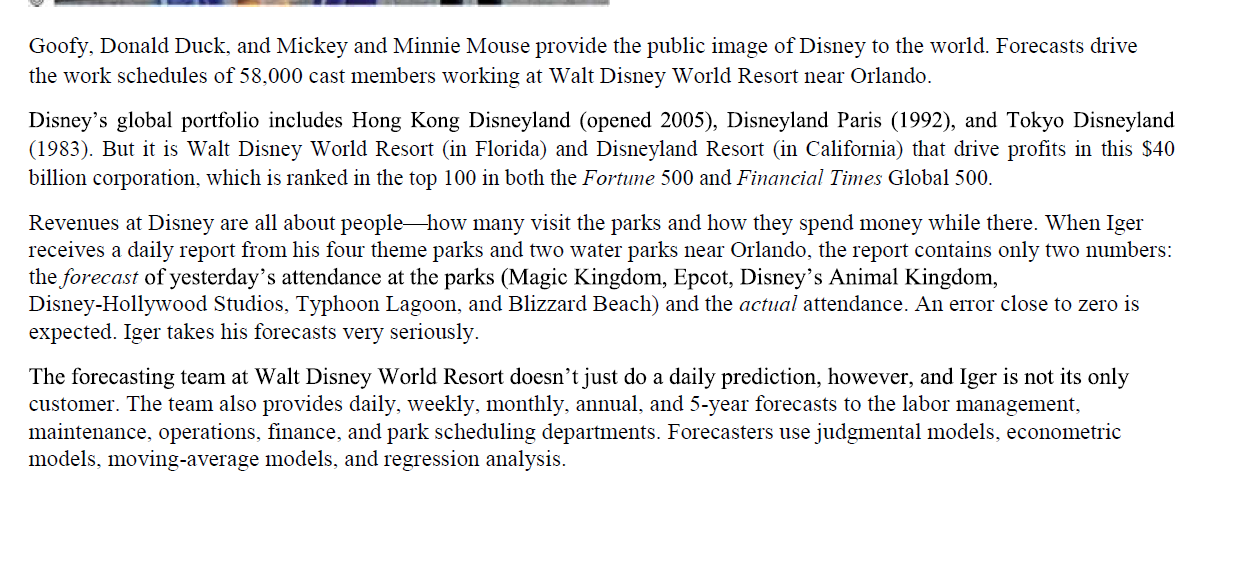
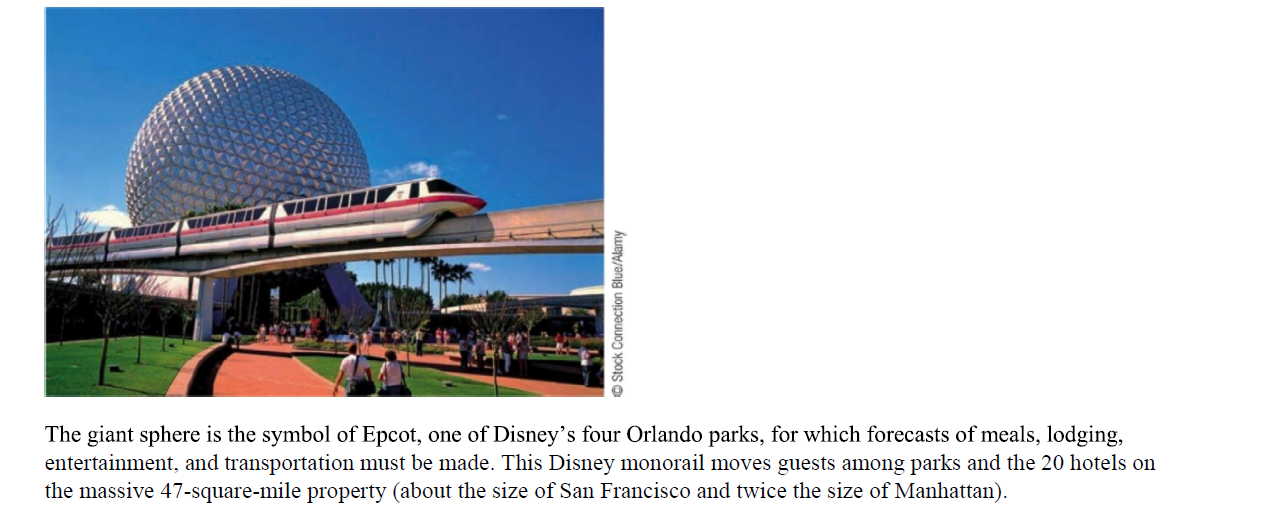
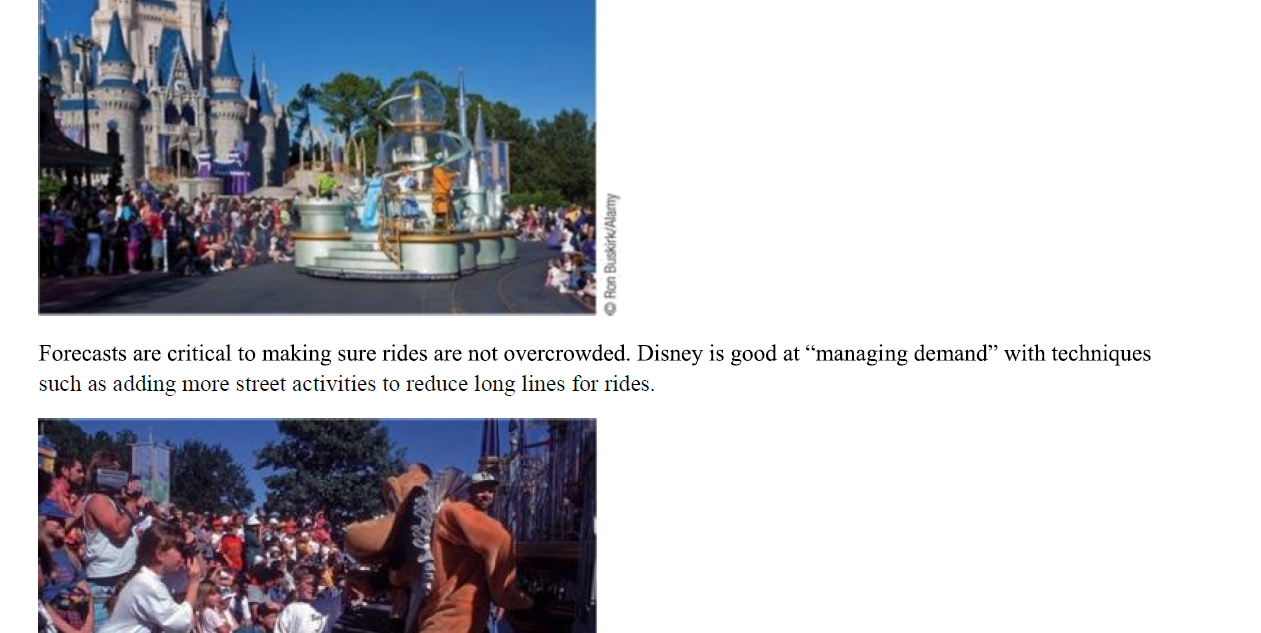
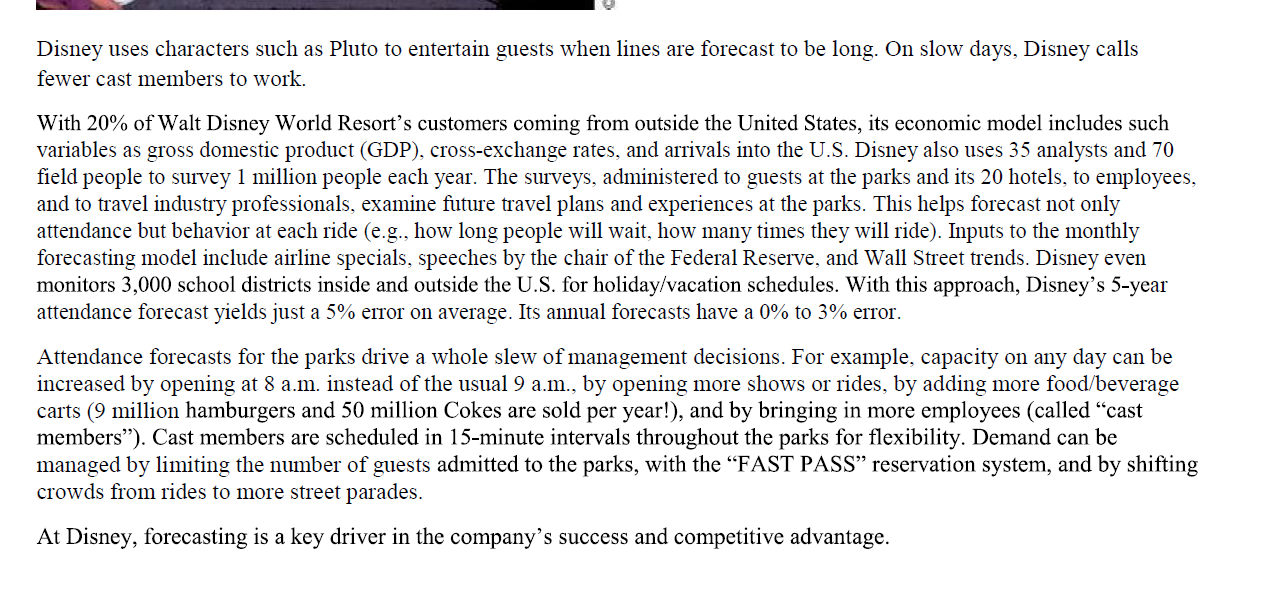
Walt Disney Parks & Resorts: Forecasting Provides a Competitive Advantage for Disney When it comes to the world's most respected global brands, Walt Disney Parks & Resorts is a visible leader. Although the monarch of this imagic kingdom is no man but a mous Mickey Mouscit's CEO Robert Iger who daily manages the entertainmenil vinil. dman/Alamy Goofy, Donald Duck, and Mickey and Minnie Mouse provide the public image of Disney to the world. Forecasts drive the work schedules of 58,000 cast members working at Walt Disney World Resort near Orlando. Disney's global portfolio includes Hong Kong Disneyland (opened 2005), Disneyland Paris (1992), and Tokyo Disneyland (1983). But it is Walt Disney World Resort (in Florida) and Disneyland Resort in Californiathat drive profits in this $40 billion corporation, which is ranked in the top 100 in both the Fortune 500 and Financial Times Global 500. Revenues at Disney are all about peoplehow many visit the parks and how they spend money while there. When Iger receives a daily report from his four theme parks and two water parks near Orlando, the report contains only two numbers: the forecast of yesterday's attendance at the parks (Magic Kingdom, Epcot, Disney's Animal Kingdom, Disney-Hollywood Studios, Typhoon Lagoon, and Blizzard Beach) and the actual attendance. An error close to zero is expected. Iger takes his forecasts very seriously. The forecasting team at Walt Disney World Resort doesn't just do a daily prediction, however, and Iger is not its only customer. The team also provides daily, weekly, monthly, annual, and 5-year forecasts to the labor management, maintenance, operations, finance, and park scheduling departments. Forecasters use judgmental models, econometric models, moving average models, and regression analysis. Stock Connection Blue/Alamy The giant sphere is the symbol of Epcot, one of Disney's four Orlando parks, for which forecasts of meals, lodging, entertainment, and transportation must be made. This Disney monorail moves guests among parks and the 20 hotels on the massive 47-square-mile property (about the size of San Francisco and twice the size of Manhattan). Rough Guides Demetrio Carrasco A daily forecast of attendance is made by adjusting Disney's annual operating plan for weather forecasts, the previous day's crowds, conventions, and seasonal variations. One of the two water parks at Walt Disney World Resort, Blizzard Beach, is shown here. Ron Buskirk/Alamy Forecasts are critical to making sure rides are not overcrowded. Disney is good at managing demand with techniques such as adding more street activities to reduce long lines for rides. Disney uses characters such as Pluto to entertain guests when lines are forecast to be long. On slow days, Disney calls fewer cast members to work. With 20% of Walt Disney World Resort's customers coming from outside the United States, its economic model includes such variables as gross domestic product (GDP), cross-exchange rates, and arrivals into the U.S. Disney also uses 35 analysts and 70 field people to survey 1 million people each year. The surveys, administered to guests at the parks and its 20 hotels, to employees, and to travel industry professionals, examine future travel plans and experiences at the parks. This helps forecast not only attendance but behavior at each ride (e.g., how long people will wait, how many times they will ride). Inputs to the monthly forecasting model include airline specials, speeches by the chair of the Federal Reserve, and Wall Street trends. Disney even monitors 3,000 school districts inside and outside the U.S. for holiday/vacation schedules. With this approach, Disney's 5-year attendance forecast yields just a 5% error on average. Its annual forecasts have a 0% to 3% error. Attendance forecasts for the parks drive a whole slew of management decisions. For example, capacity on any day can be increased by opening at 8 a.m. instead of the usual 9 a.m., by opening more shows or rides, by adding more food/beverage carts (9 million hamburgers and 50 million Cokes are sold per year!), and by bringing in more employees (called cast members). Cast members are scheduled in 15-minute intervals throughout the parks for flexibility. Demand can be managed by limiting the number of guests admitted to the parks, with the FAST PASS reservation system, and by shifting crowds from rides to more street parades. At Disney, forecasting is a key driver in the company's success and competitive advantage
Step by Step Solution
There are 3 Steps involved in it

Get step-by-step solutions from verified subject matter experts