

Question: Read the instruction below and Answer the questions by using MATLAB software. Cannot attached the excel file and thus I screen shot the excel file
Read the instruction below and Answer the questions by using MATLAB software. Cannot attached the excel file and thus I screen shot the excel file and post the image below instead of attached the excel file. Please copy the image to the microsoft excel in your computer and answer the questions. Please explain the answers clearly!!! Excel file name: Asheville_1999
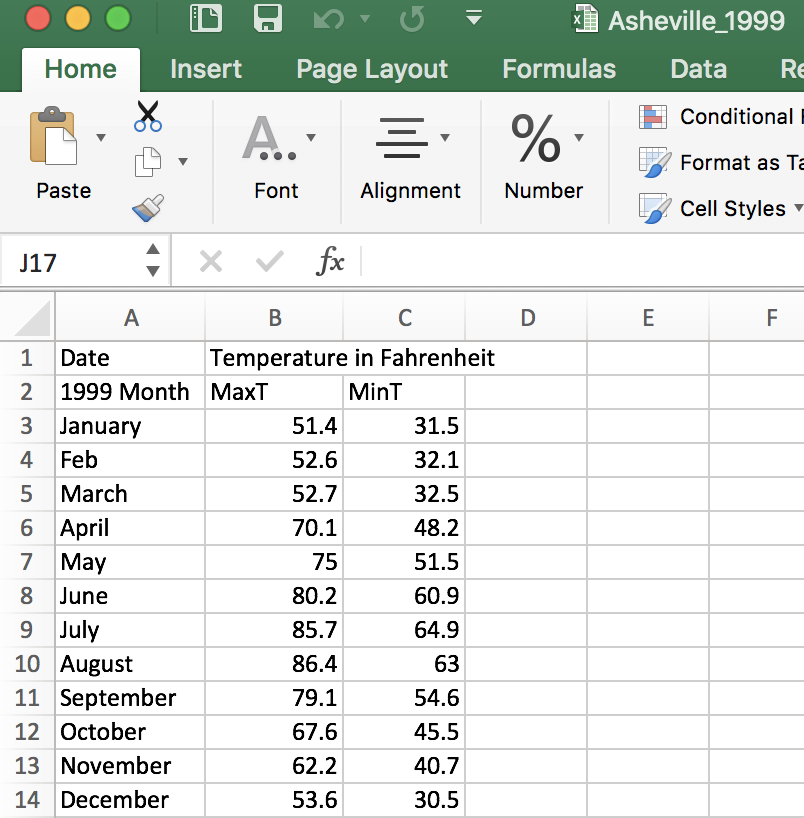
Data collected by the national Weather Service are good to practice data manipulations in MATLAB. Take for example the Asheville North Carolina Climatological data of 1999 in EXCEL file format. We'll use these data to input it to MATLAB and generate plots. Data are in the Excel file called Asheville_1999.xls. The goal of this project is to calculate annual means of maximum and minimum temperatures and plot graphs to display temperatures versus each month. DOC FILE (4 points): 1. (1 point) State the problem 2. (1 point) Describe the input, output for this project. Input: Output: (0.5 points) Calculate the annual average maxT and mint average maxT average mint average maxT = average minT (0.5 points) Calculate the maximum average maxT and minT maximum maxT and maximum mint maximum maxT maximum minT (1 point) Copy and paste your fig files output of your two plots here
Step by Step Solution
There are 3 Steps involved in it

Get step-by-step solutions from verified subject matter experts