

Question: Read the instructions carefully and give exact answer. Rating will be given based on quality. The tables to the right give price-demand and price-supply data

Read the instructions carefully and give exact answer. Rating will be given based on quality.
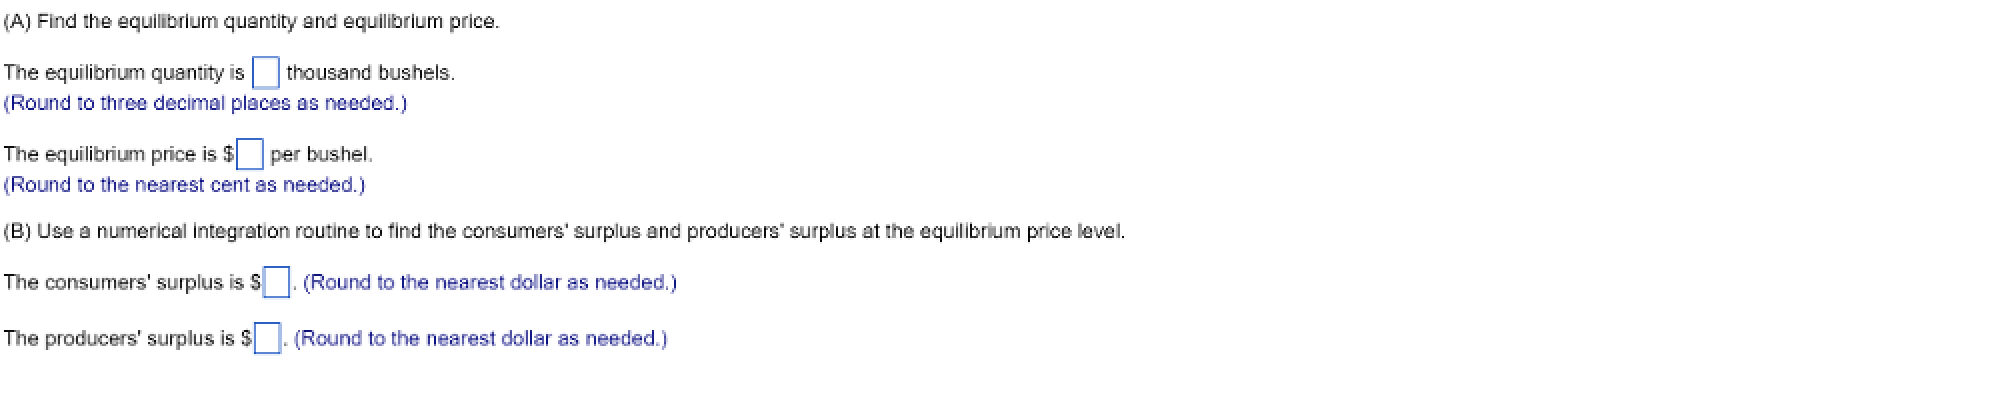

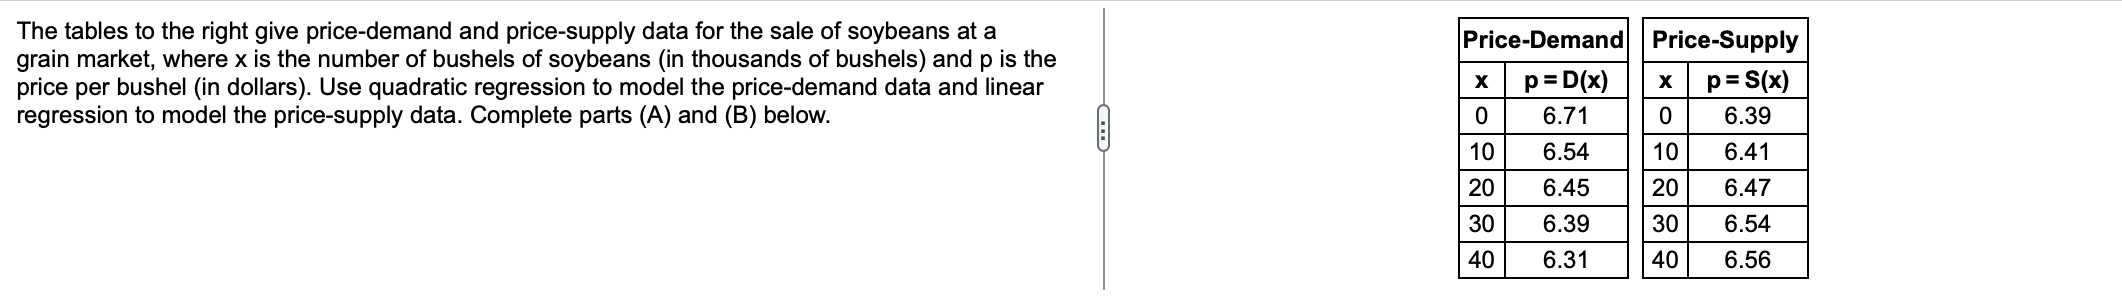
The tables to the right give price-demand and price-supply data for the sale of soybeans at a grain market, where x is the number of bushels of soybeans (in thousands of bushels) and p is the price per bushel (in dollars). Use quadratic regression to model the price-demand data and linear regression to model the price-supply data. Complete parts (A) and (B) below. Price-Demand Price-Supply x p = D(x) x p = S(x) O 6.71 0 6.39 10 6.54 '10 6.41 20 6.45 20 6.47 30 6.39 30 6.54 40 6.31 40 6.56
Step by Step Solution
There are 3 Steps involved in it
1 Expert Approved Answer
Step: 1 Unlock

Question Has Been Solved by an Expert!
Get step-by-step solutions from verified subject matter experts
Step: 2 Unlock
Step: 3 Unlock