

Question: READ THE QUESTION AND DO IT a value between 40 10. Draw a graph for the standard normal distribution. Label the horizontal axis at values
READ THE QUESTION AND DO IT
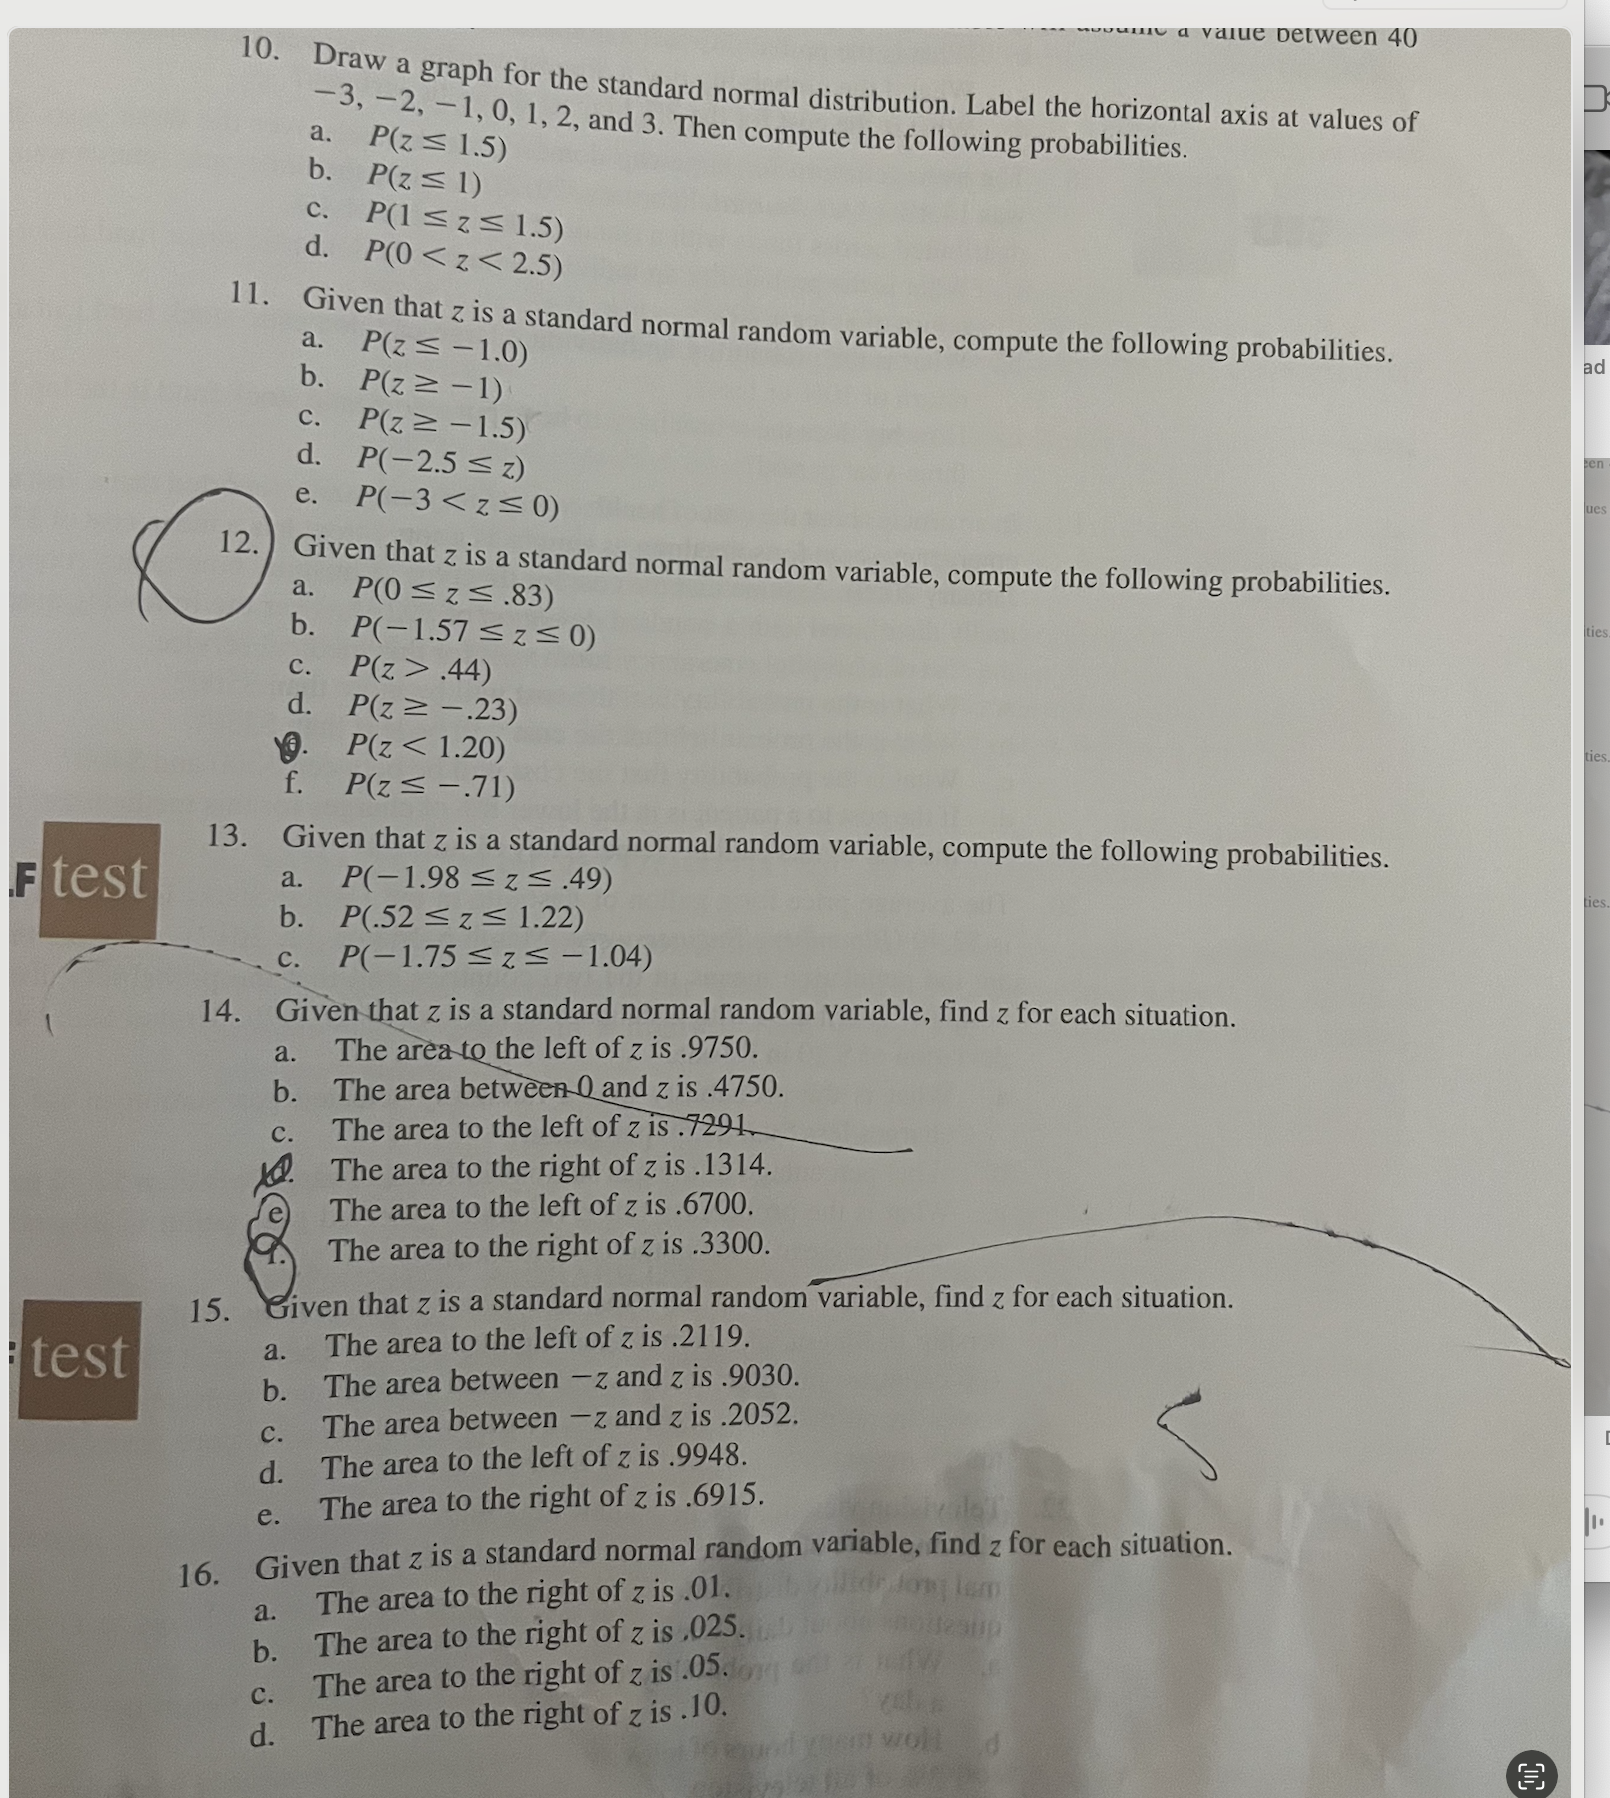
a value between 40 10. Draw a graph for the standard normal distribution. Label the horizontal axis at values of a. P ( z = 1.5 ) -3, -2, - 1, 0, 1, 2, and 3. Then compute the following probabilities. b. P(z = 1 ) c. P(1 . 44) d. P(z > -.23) P(z
Step by Step Solution
There are 3 Steps involved in it
1 Expert Approved Answer
Step: 1 Unlock

Question Has Been Solved by an Expert!
Get step-by-step solutions from verified subject matter experts
Step: 2 Unlock
Step: 3 Unlock