Question: Read this guide for help: https://downstream-to-capsim-customers.s3.amazonaws.com/production/resources/Comp_XM/pdf/Comp-XM_Examination_Guide.pdf Please help me make decisions in Capsim for research and development, marketing, production, finance, HR, and TQM. Please reference
Read this guide for help: https://downstream-to-capsim-customers.s3.amazonaws.com/production/resources/Comp_XM/pdf/Comp-XM_Examination_Guide.pdf
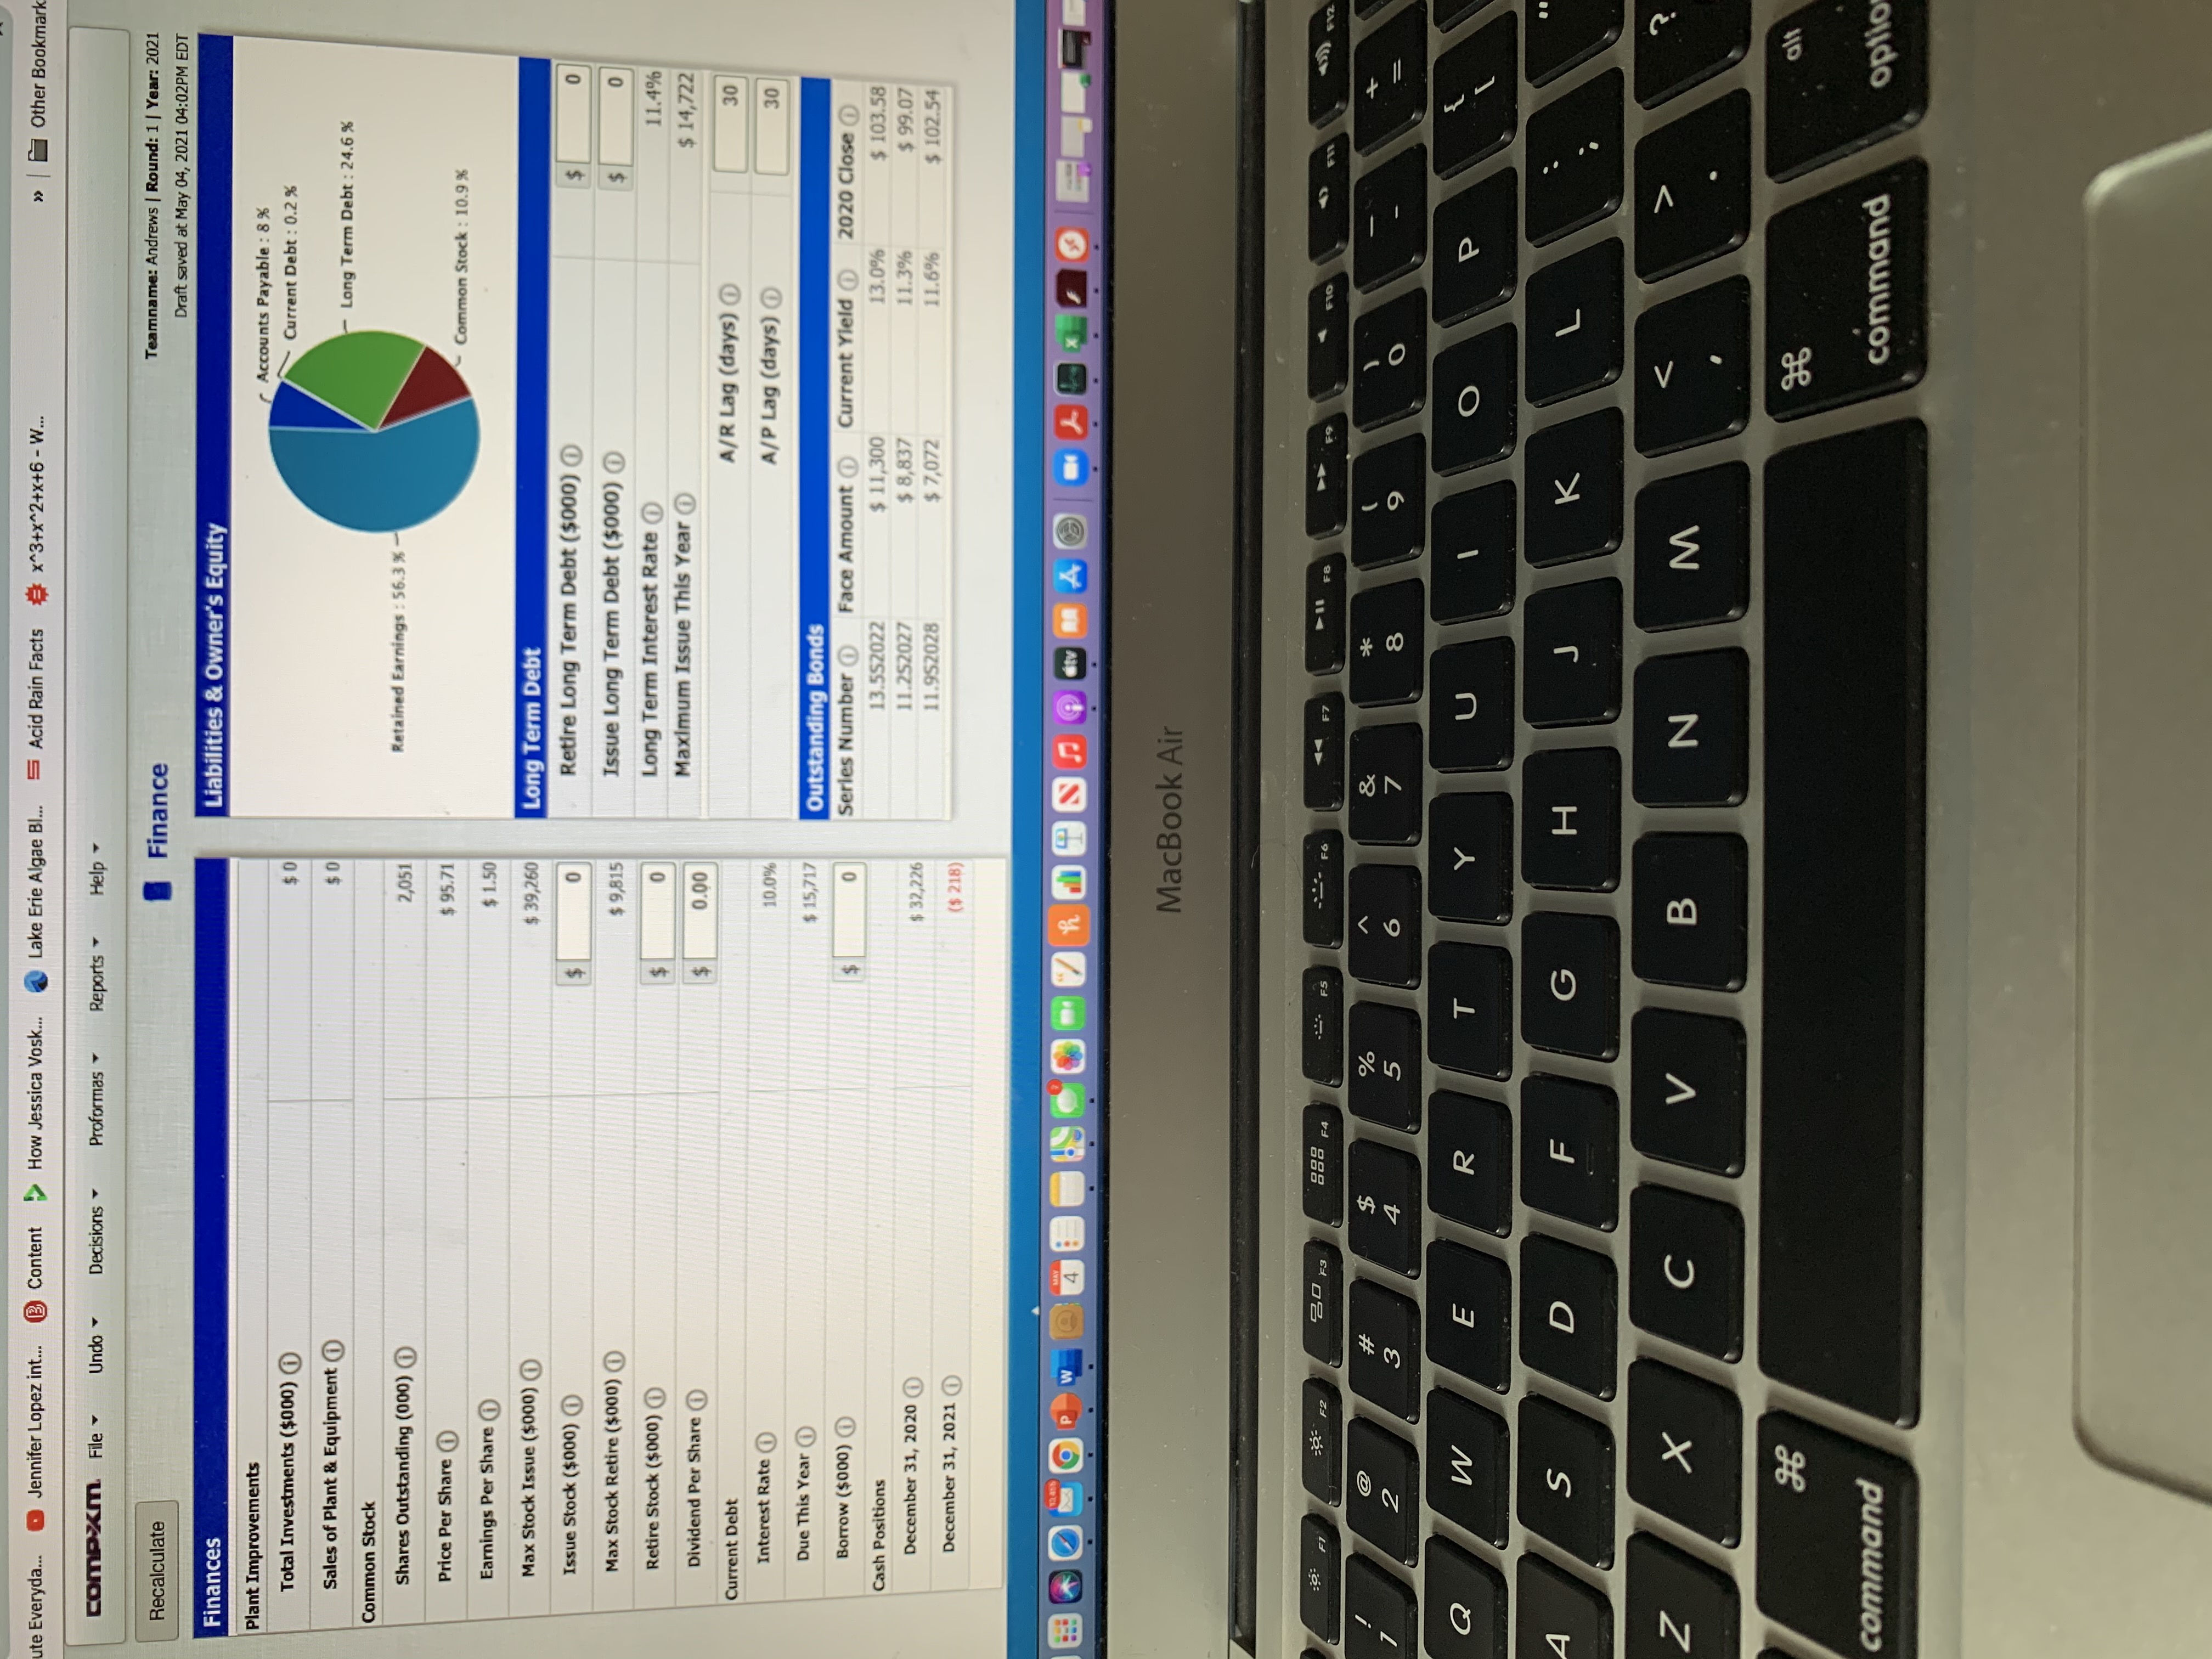
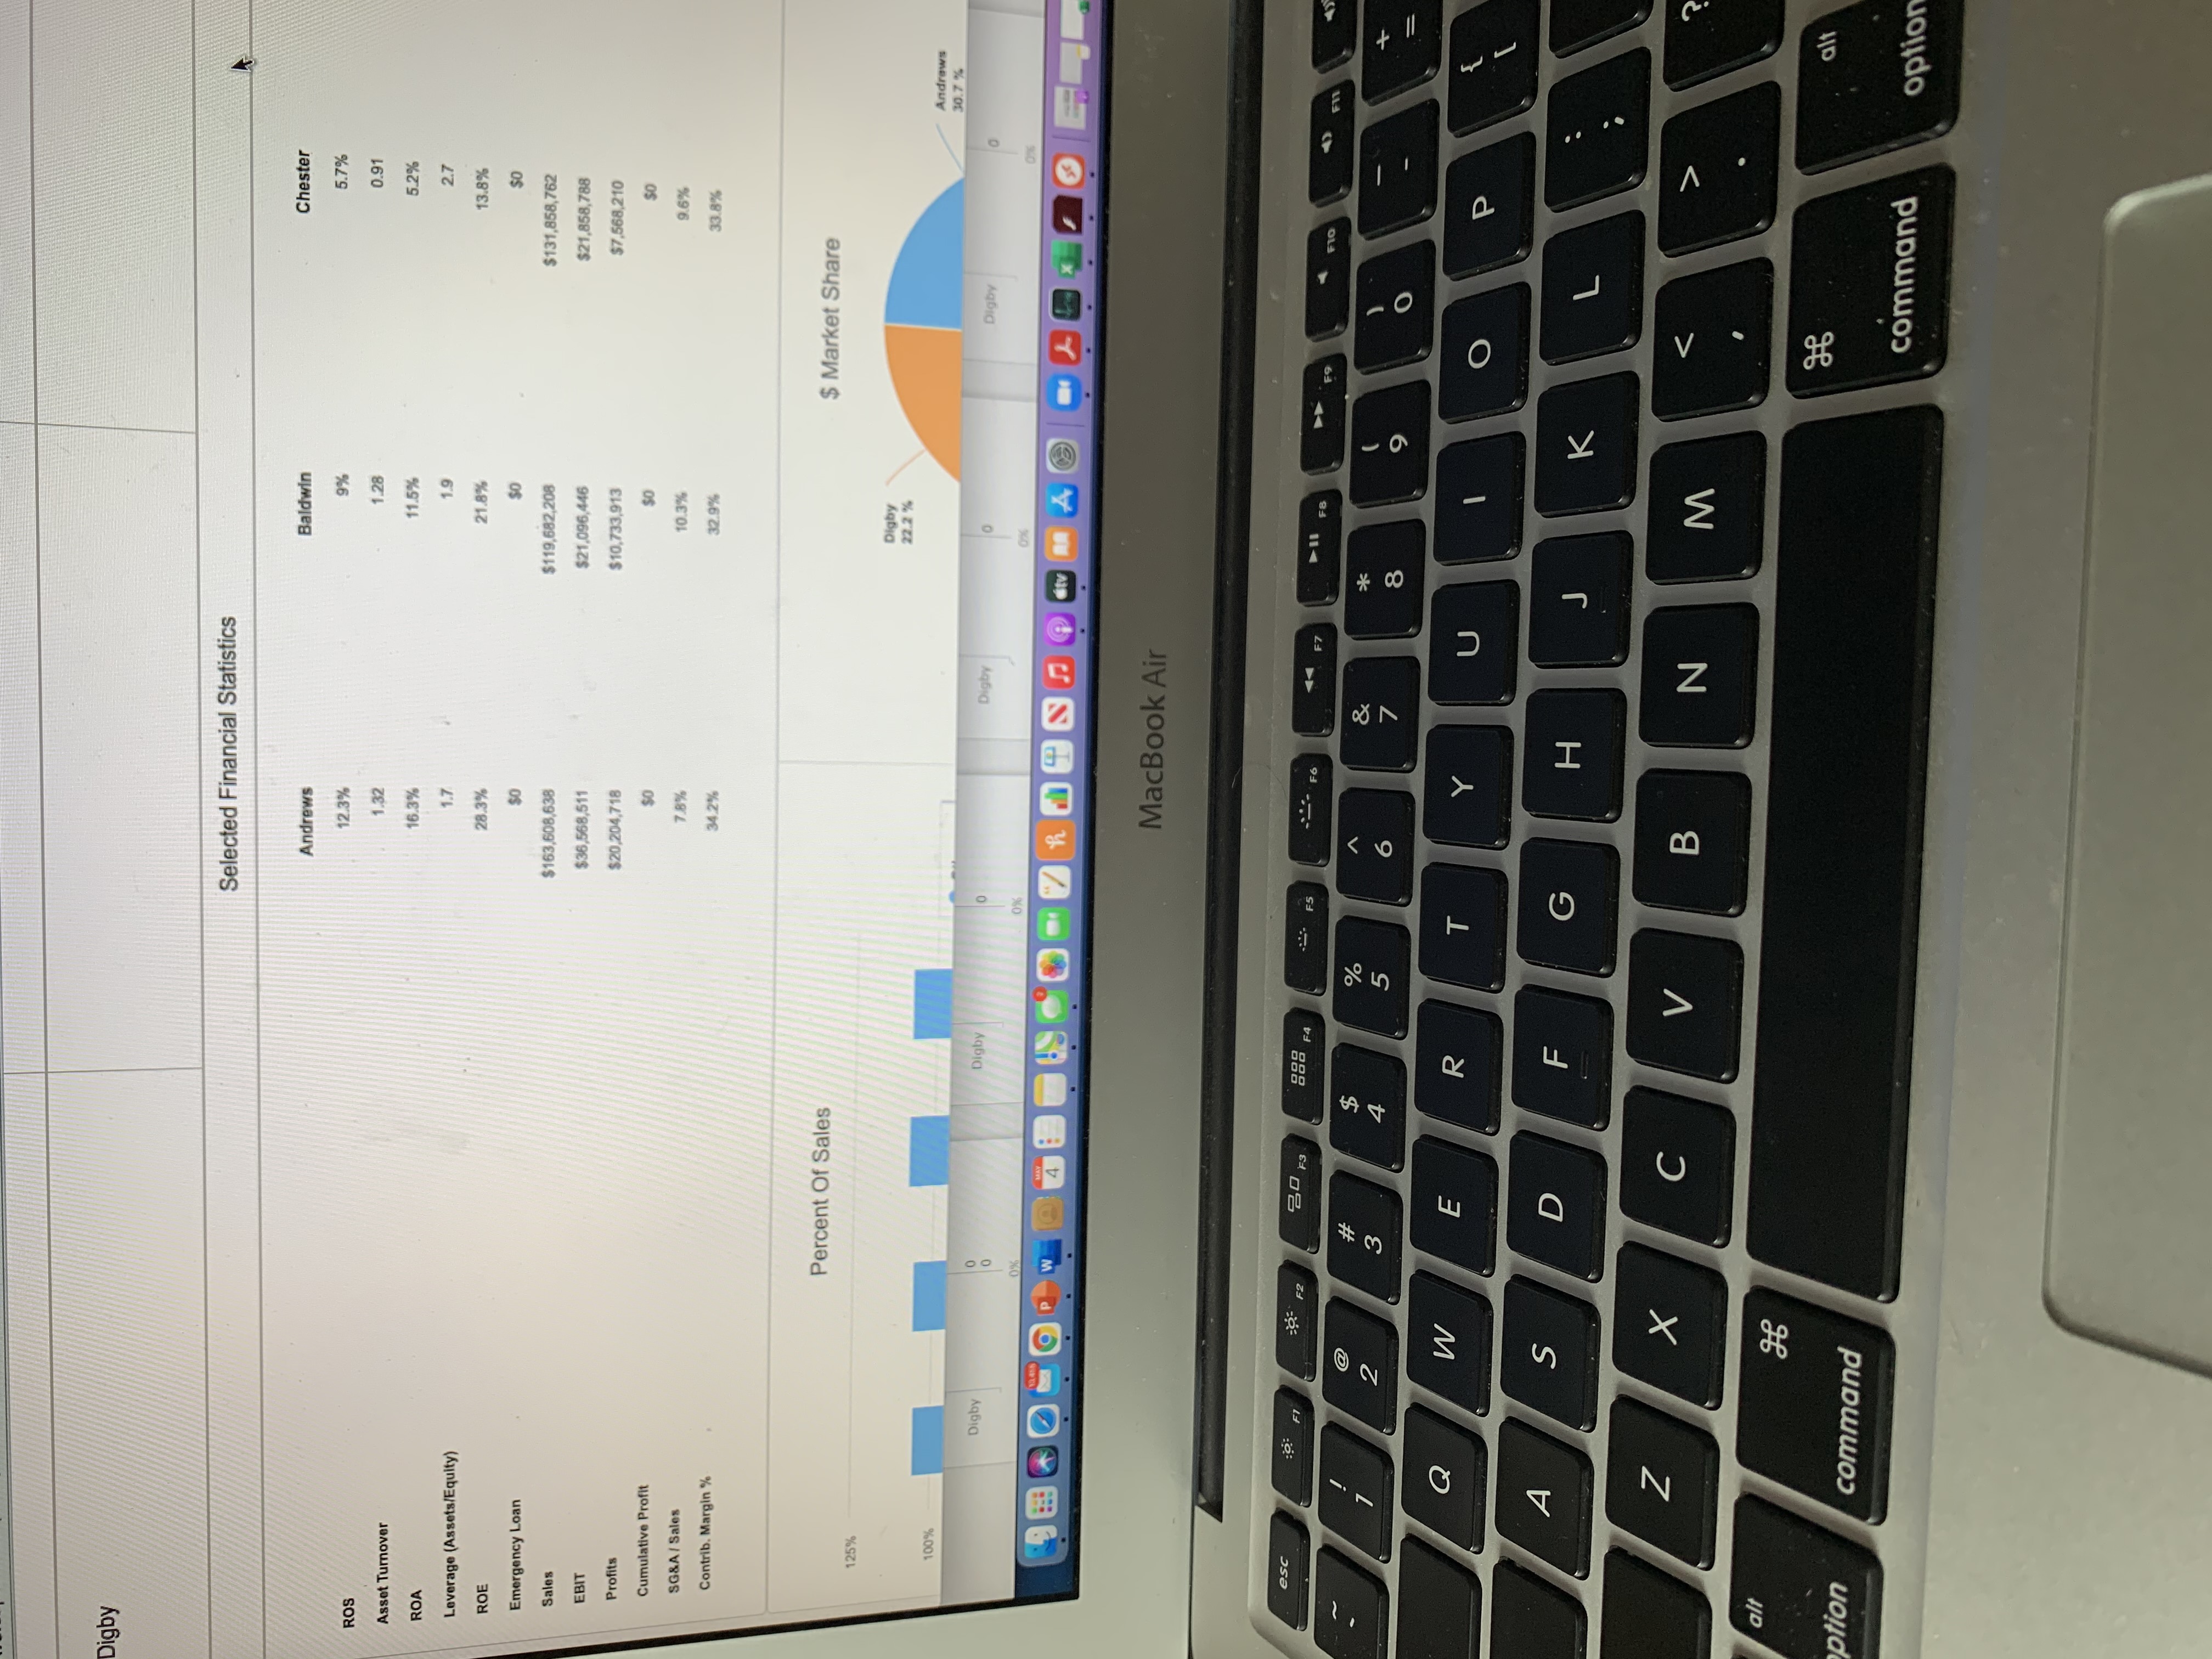
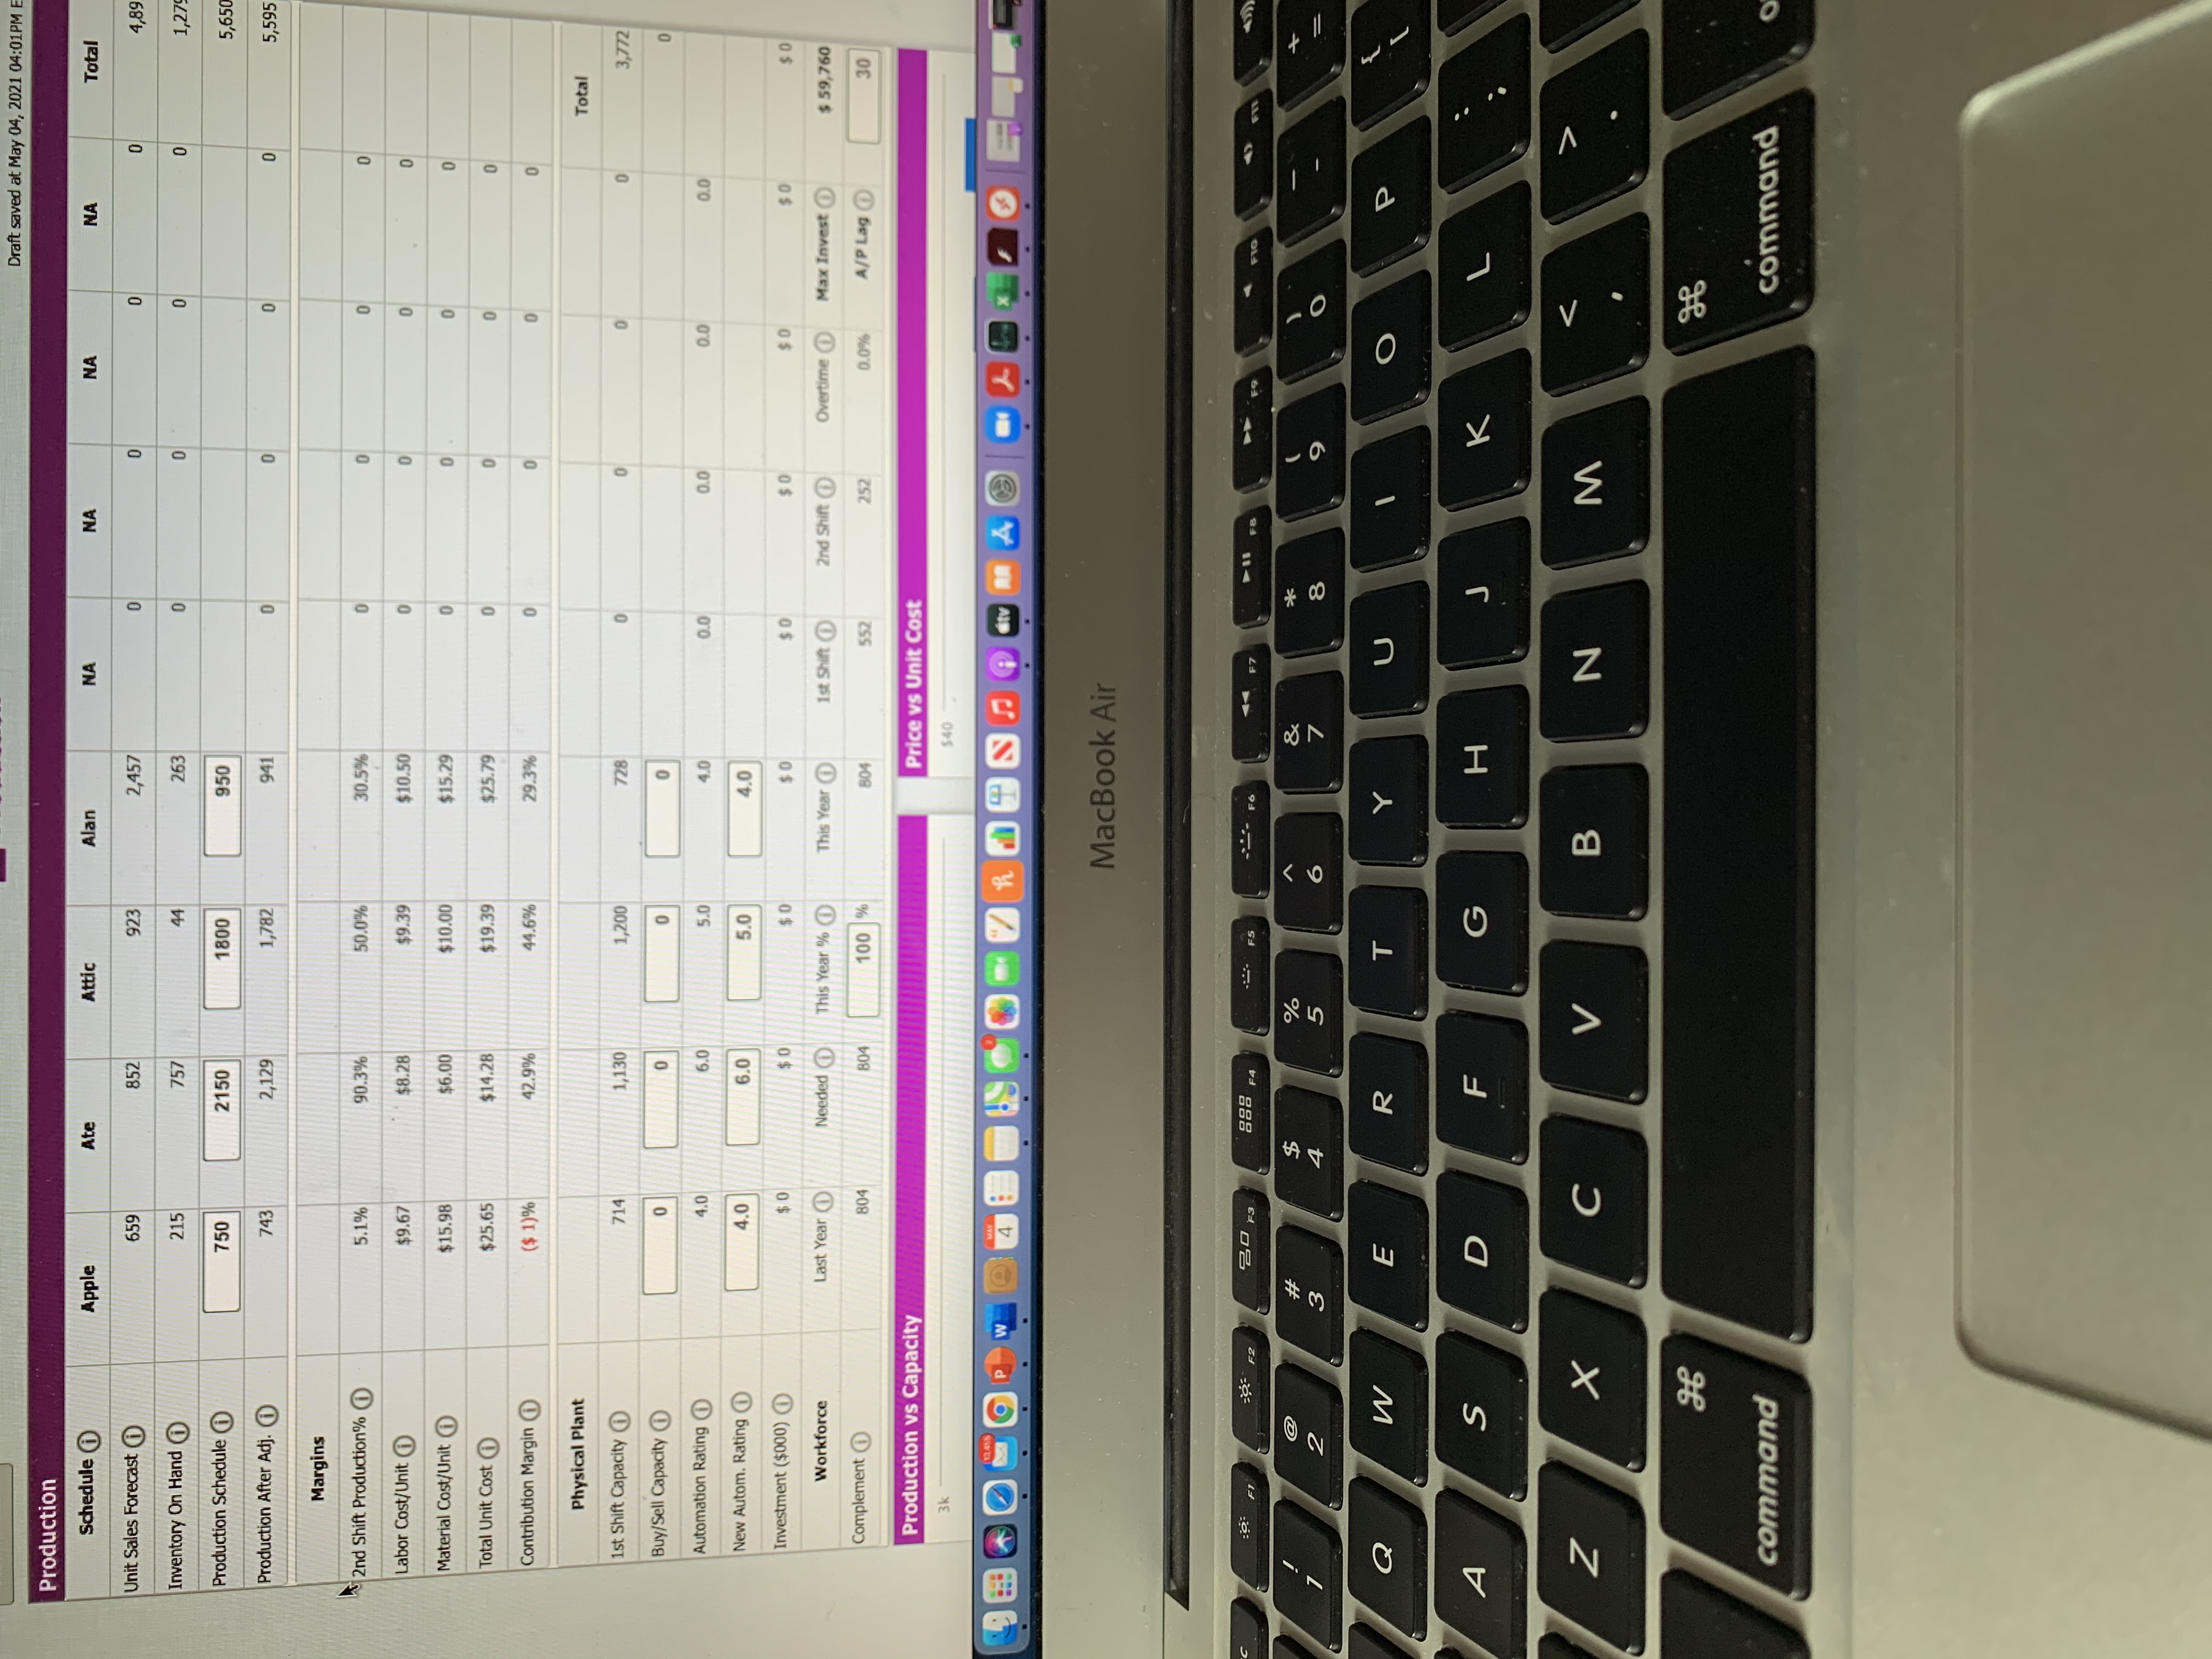
Please help me make decisions in Capsim for research and development, marketing, production, finance, HR, and TQM. Please reference the attachments below. Thank you in advance for your help!
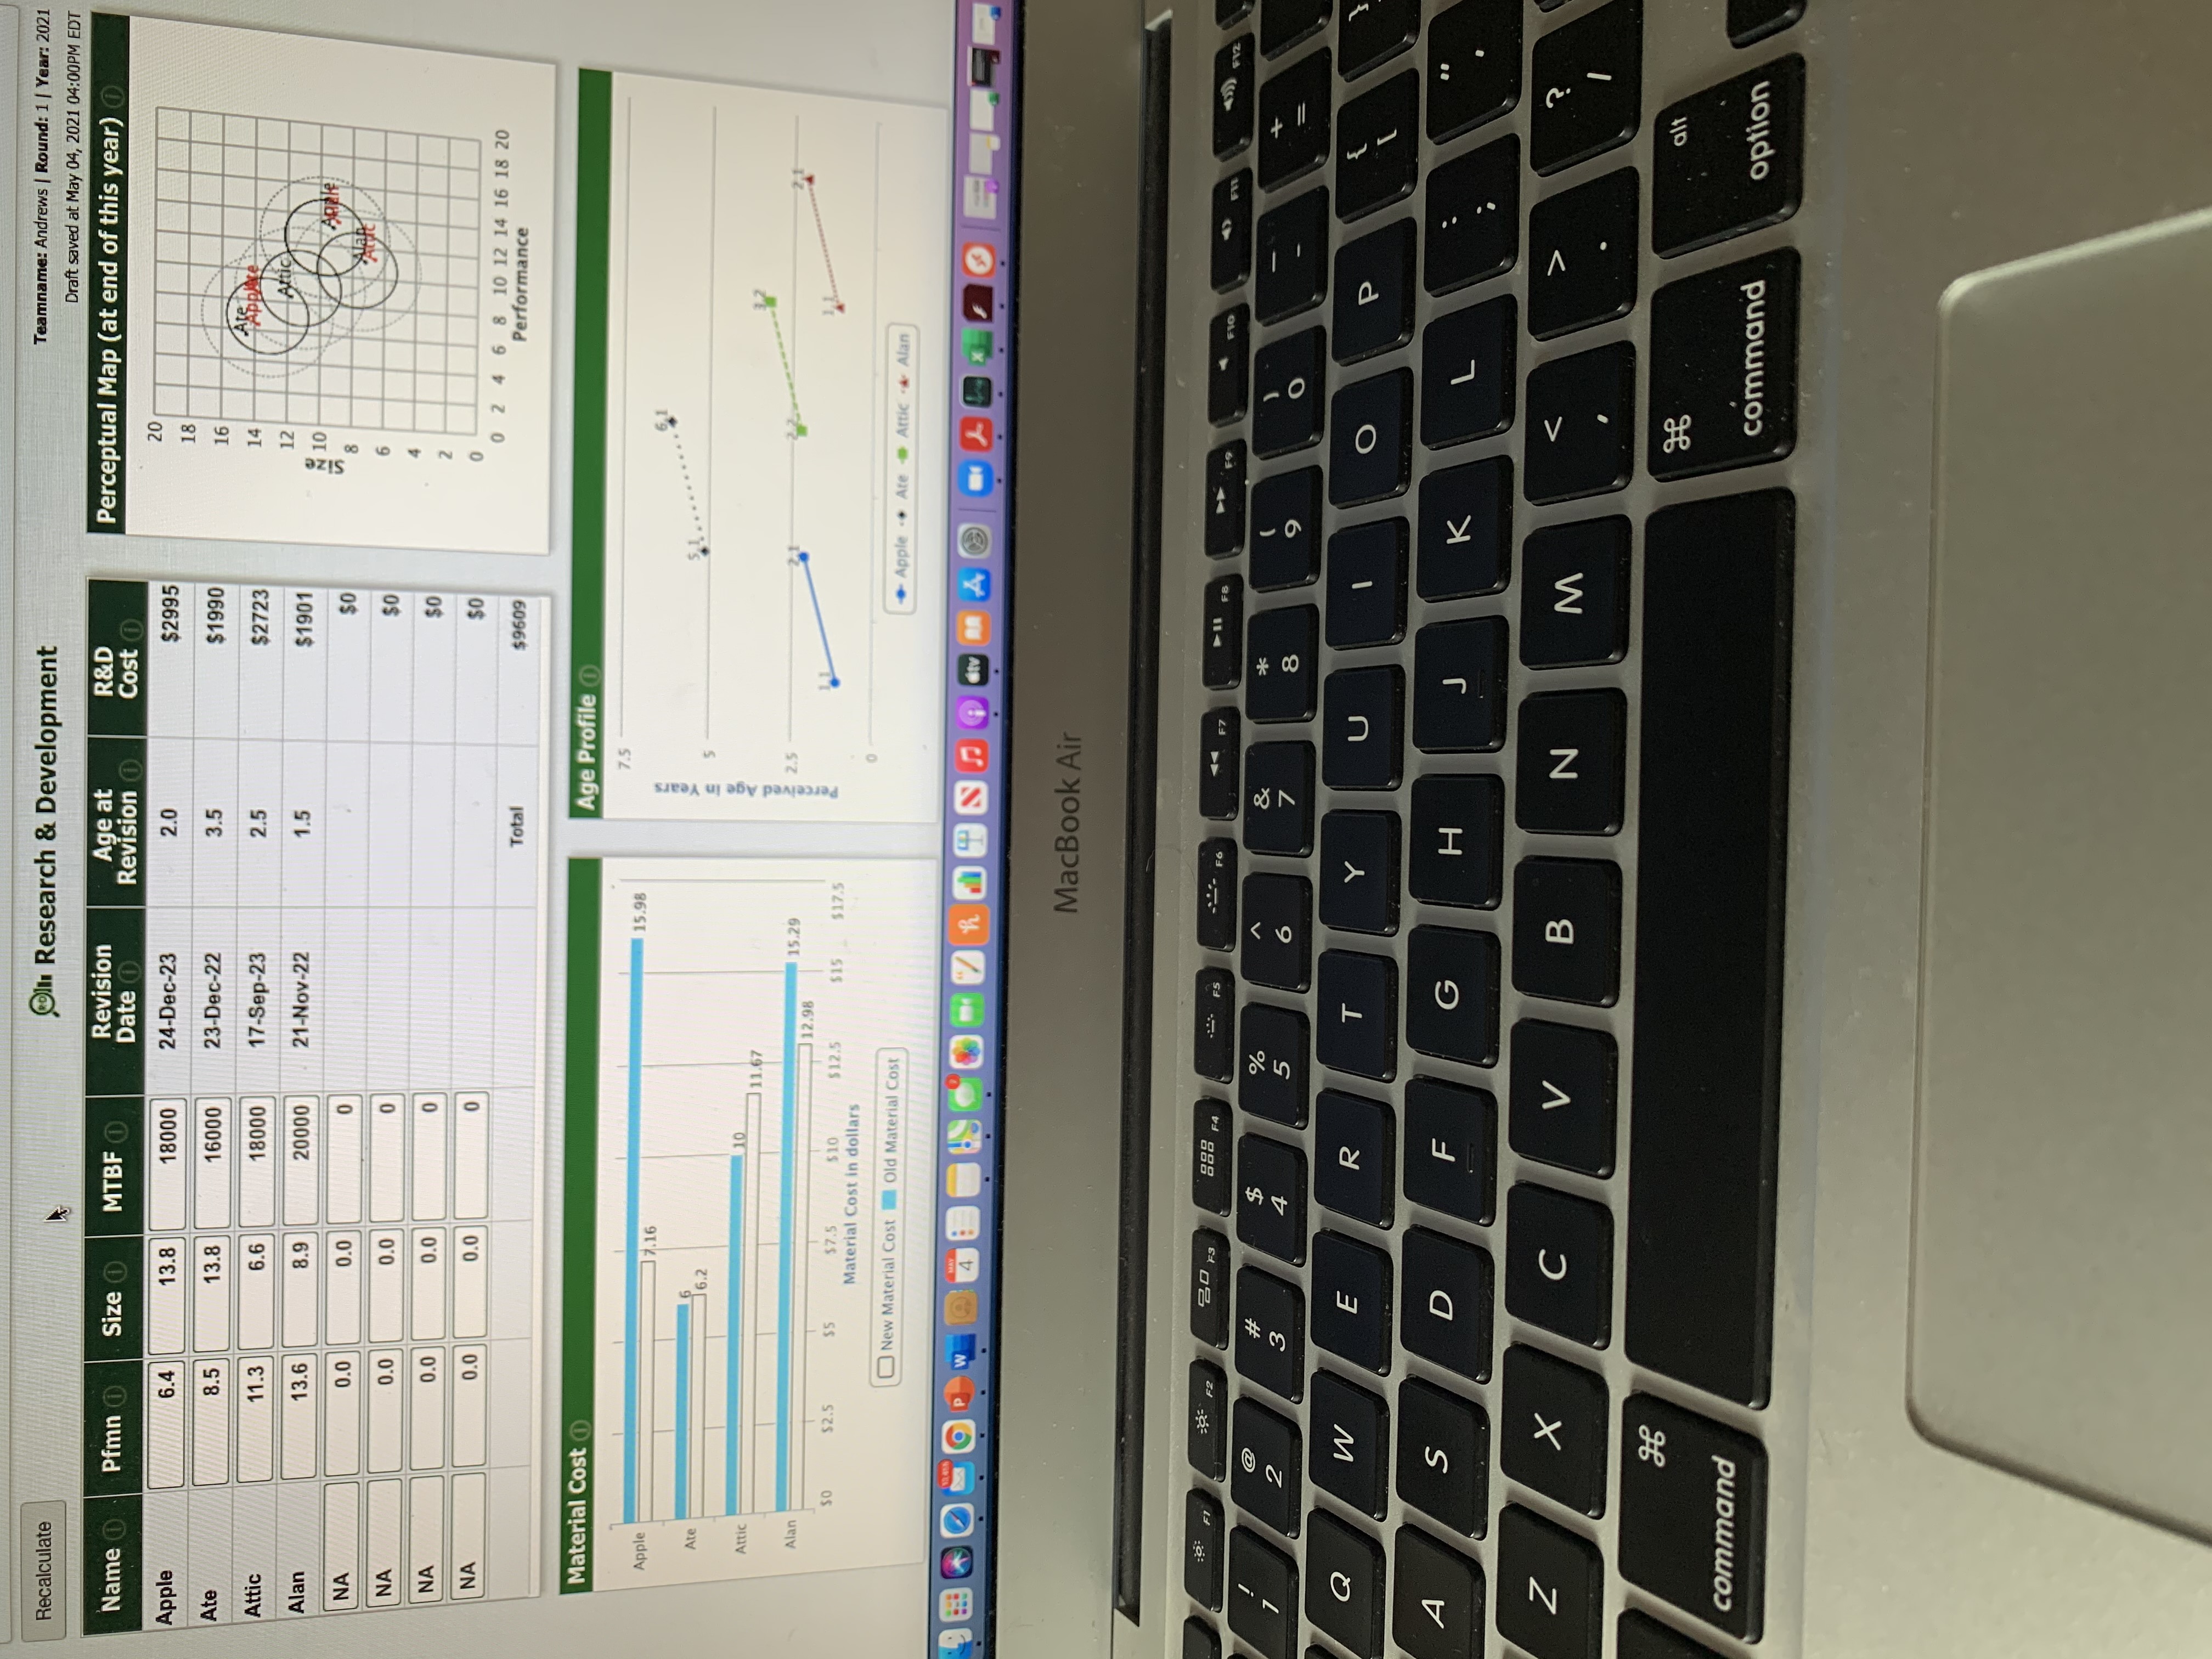
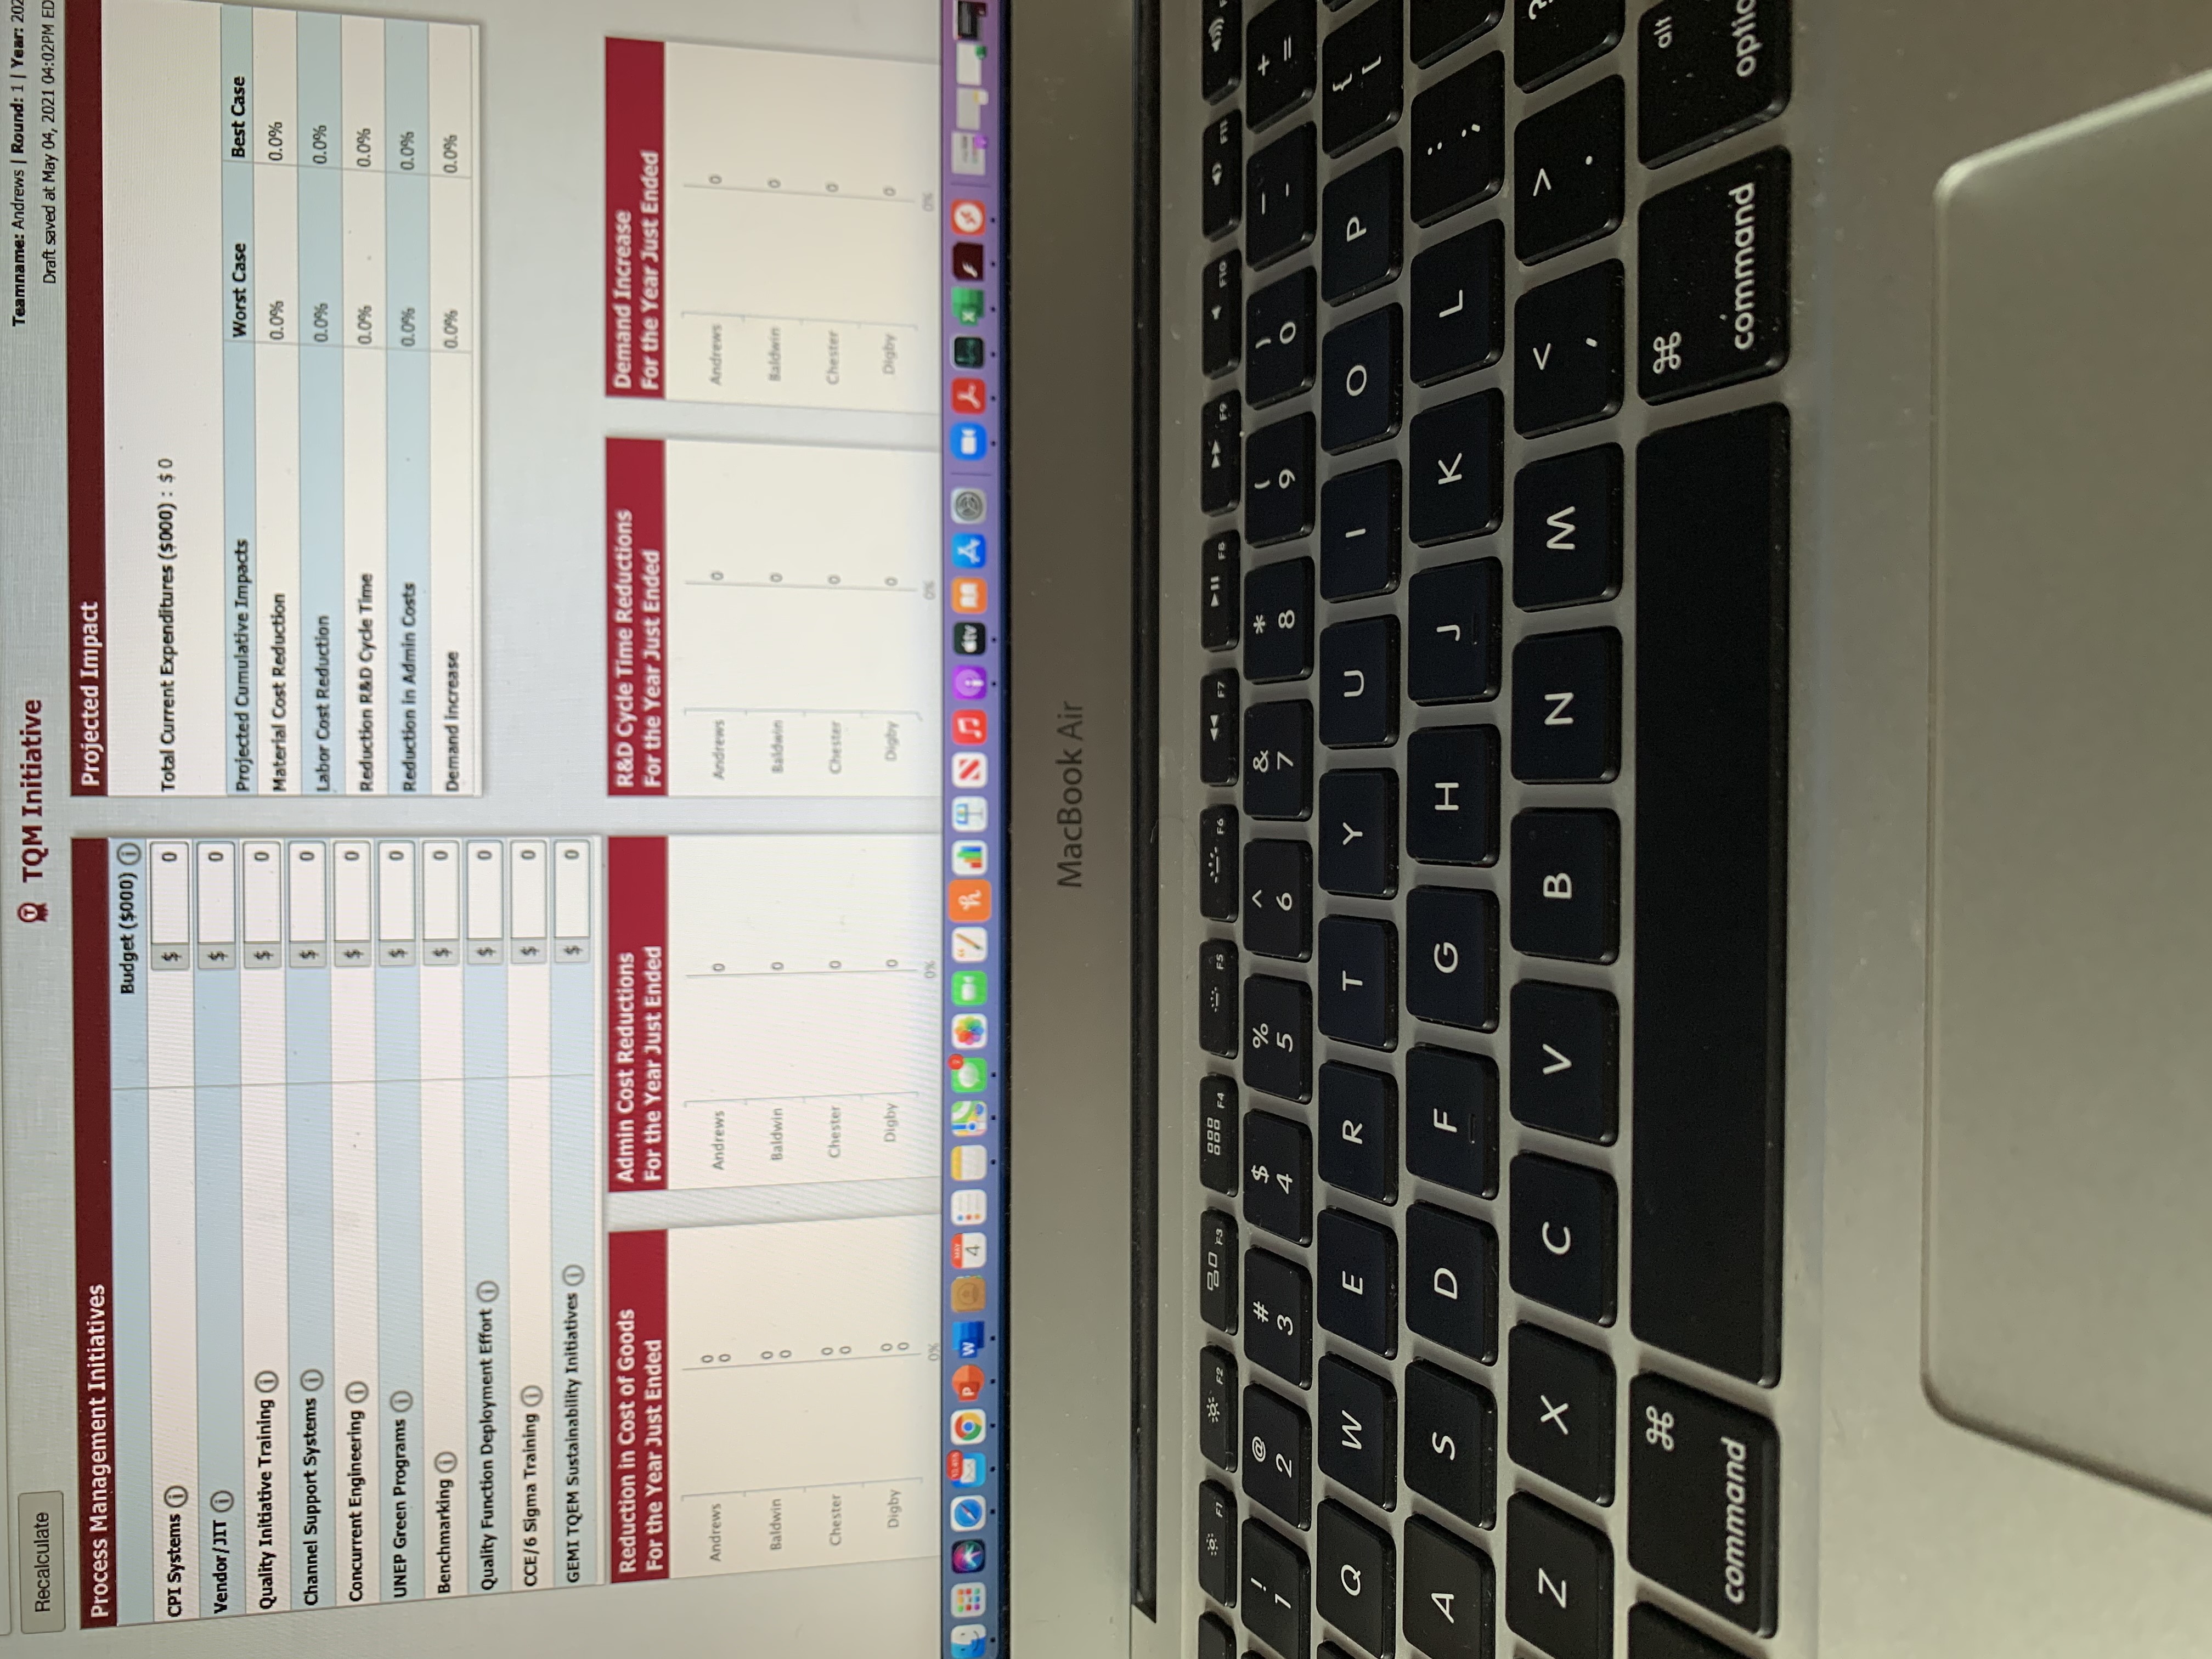
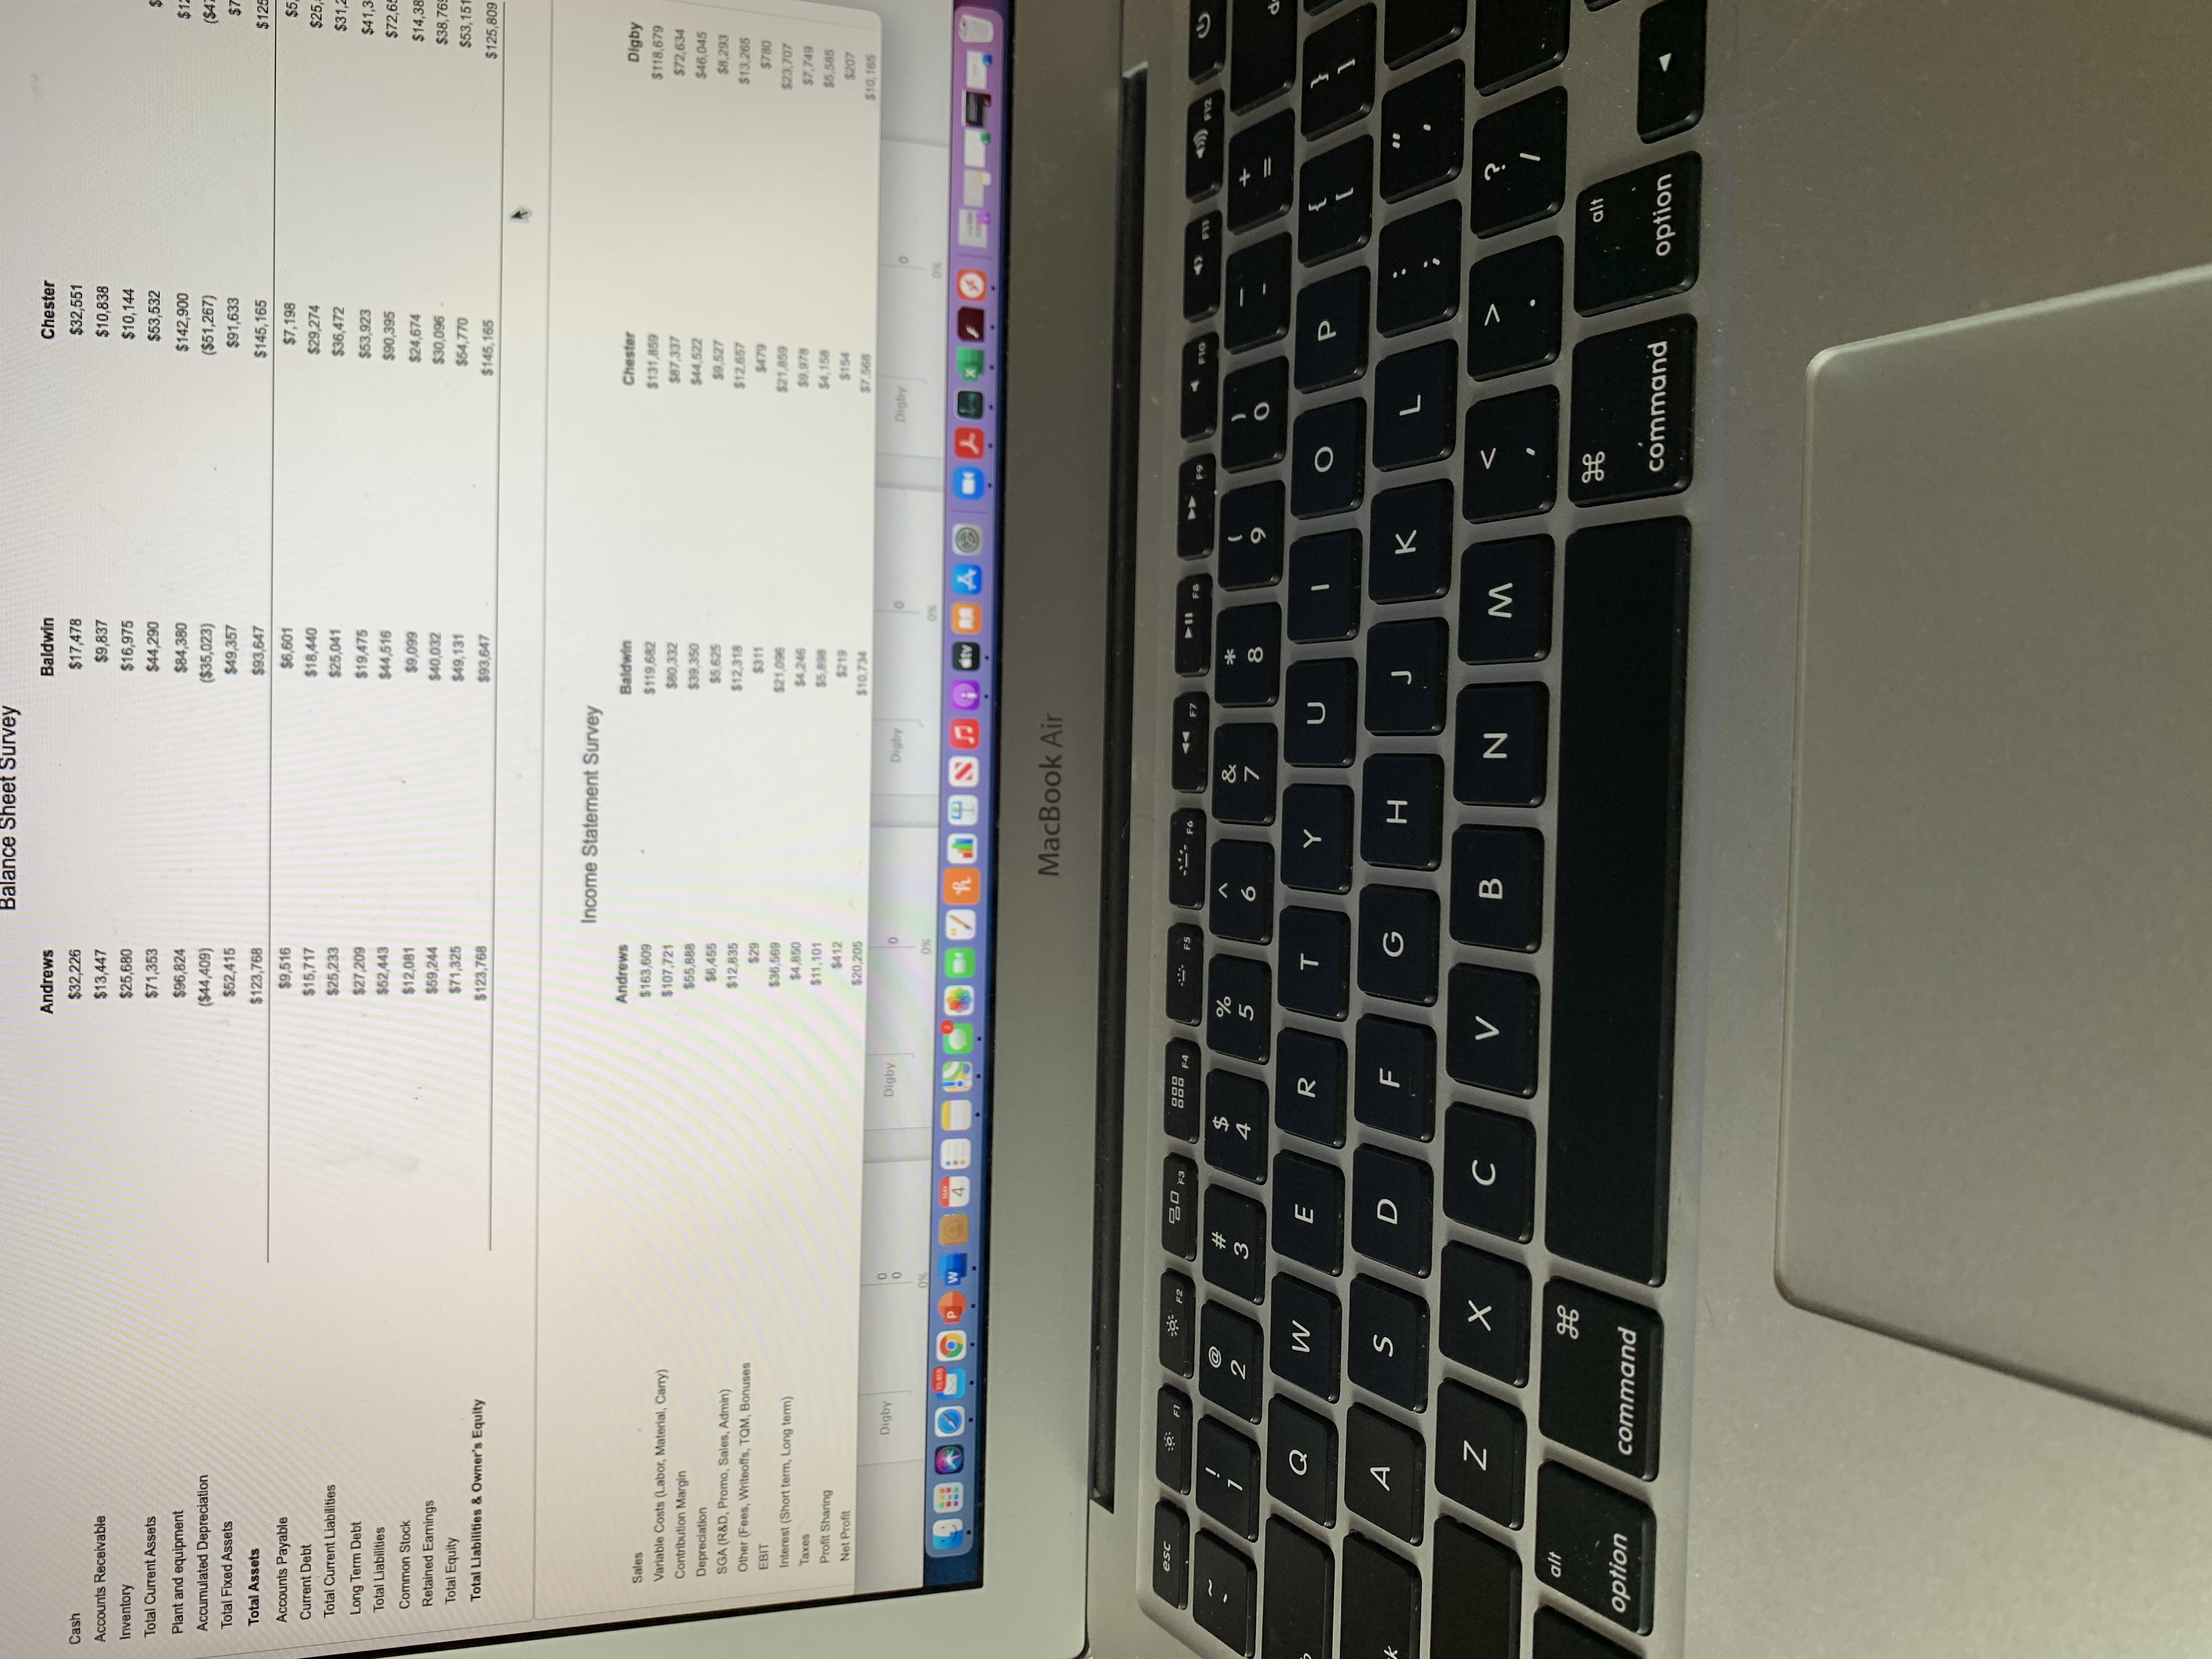
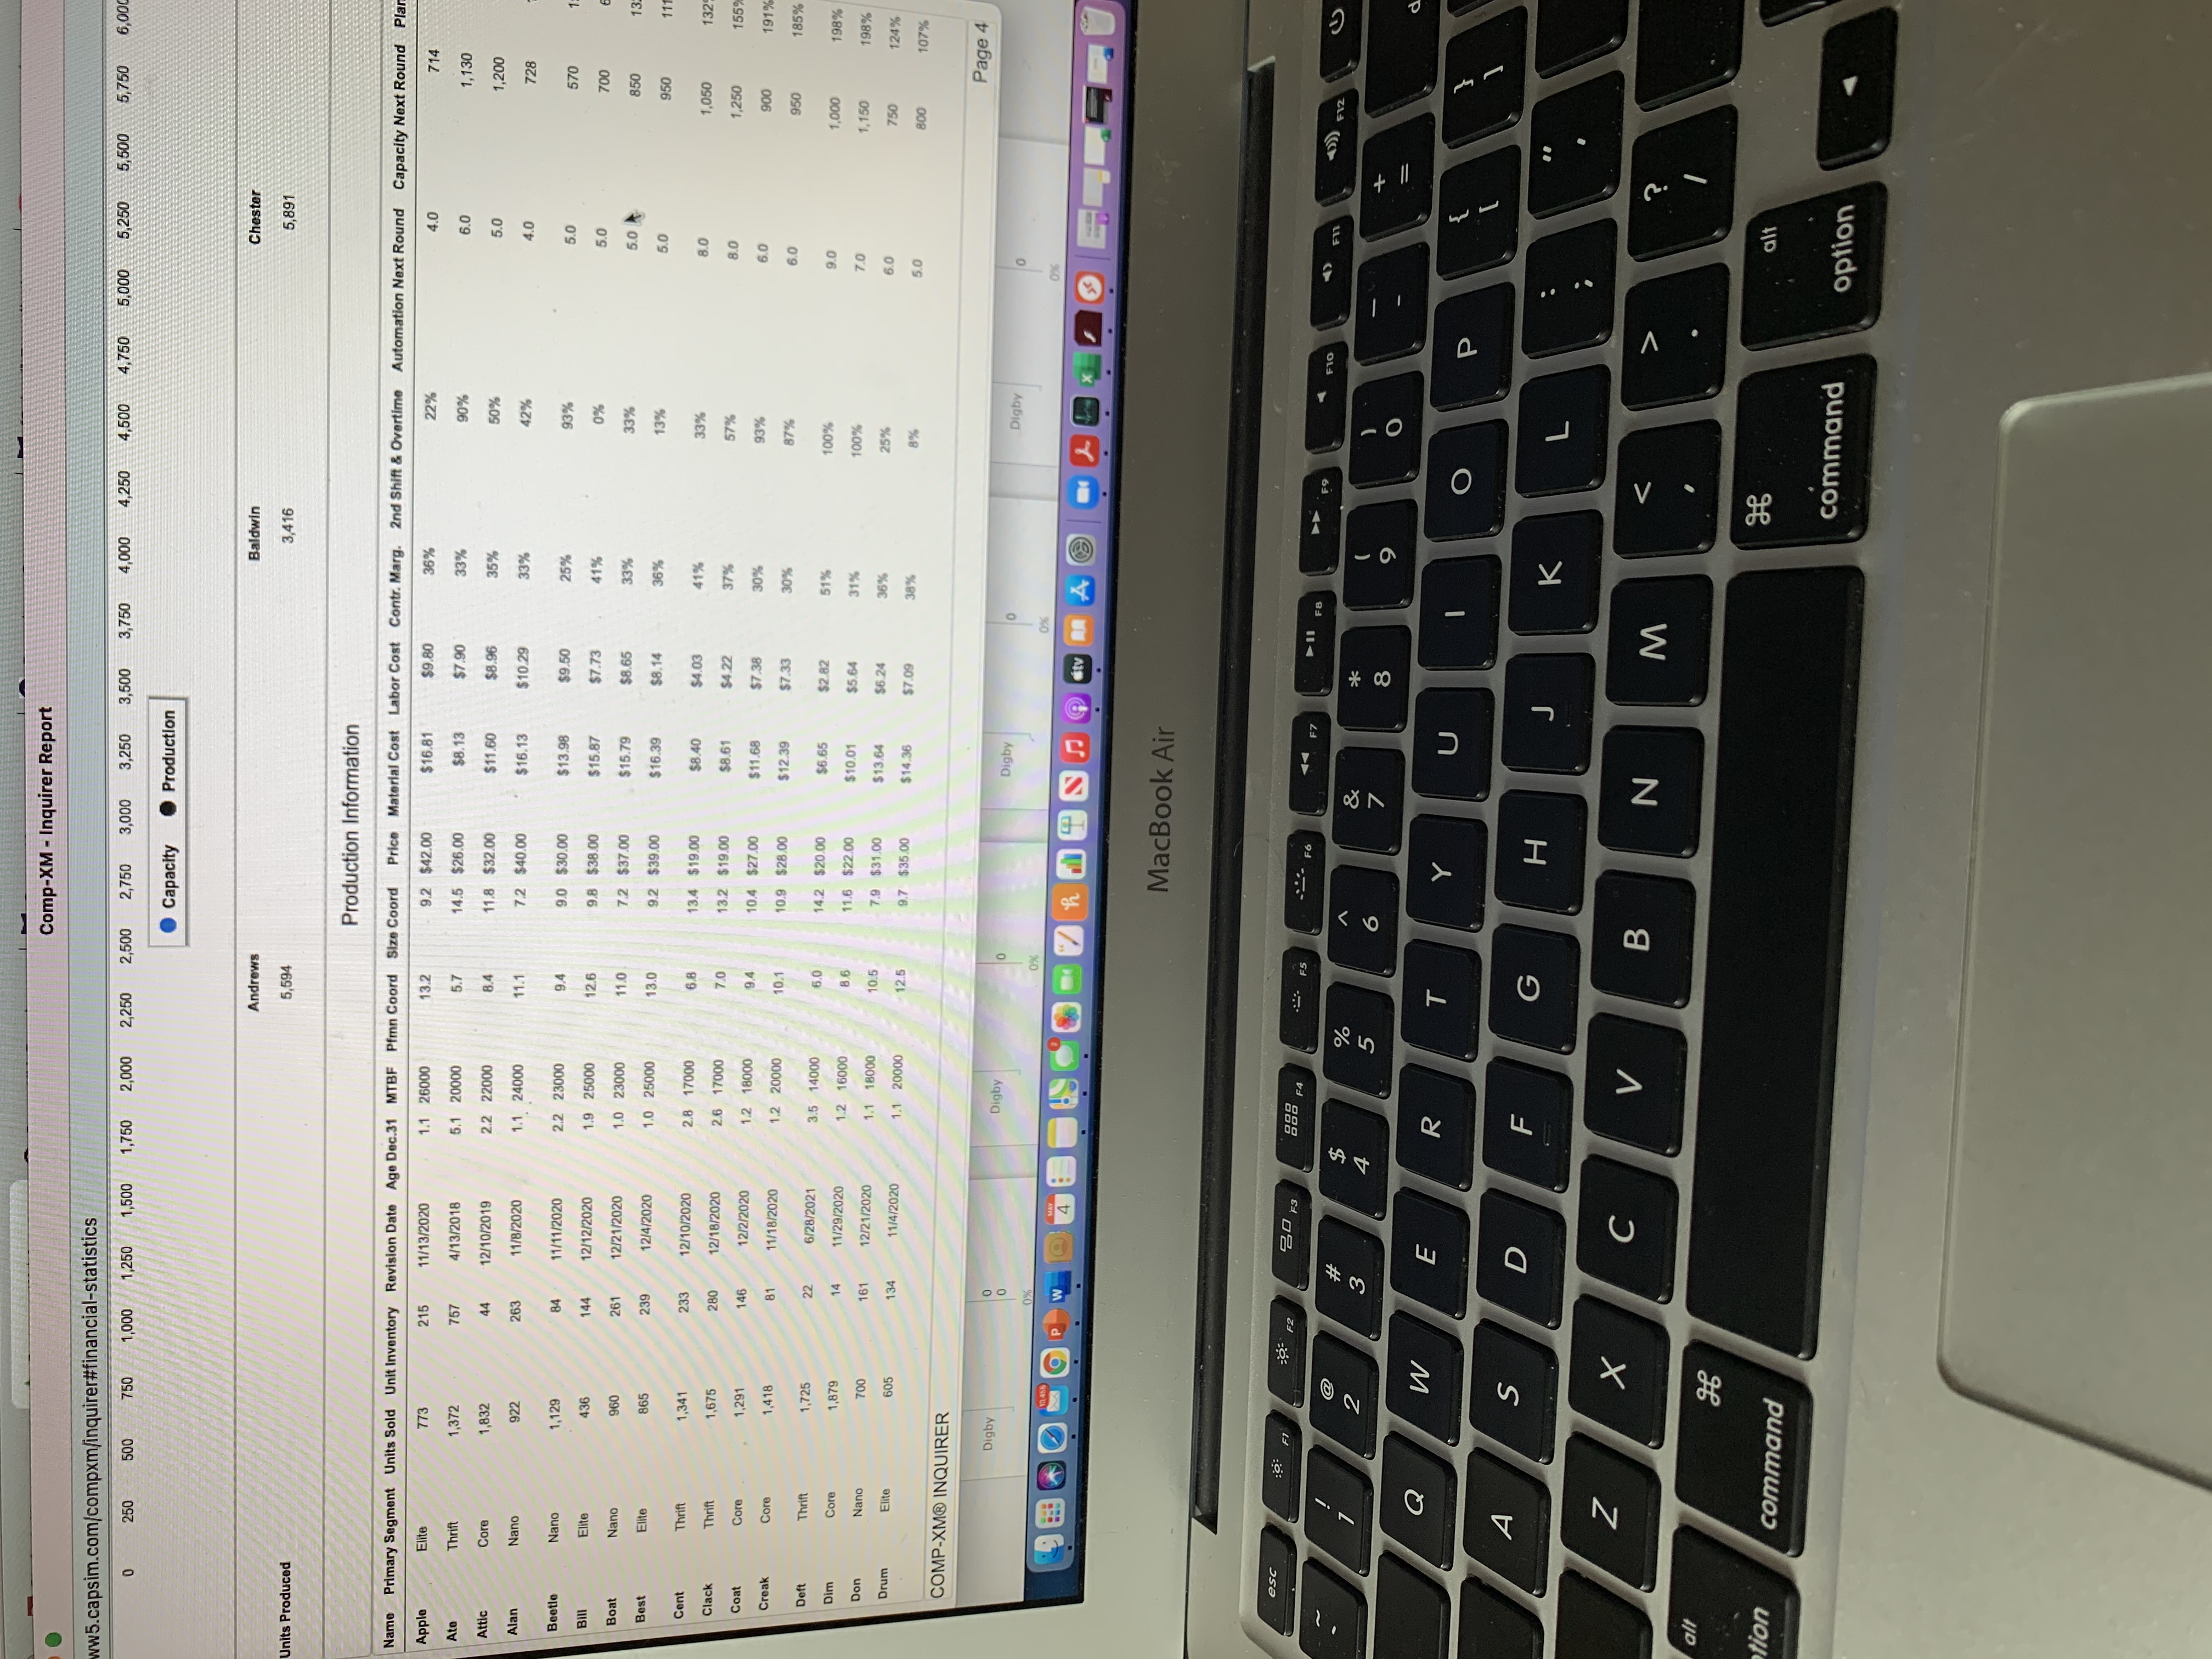
Recalculate @1 Research & Development Teamname: Andrews | Round: 1 | Year: 2021 Draft saved at May 04, 2021 04:00PM EDT R&D Name O Pfmn Size O MTBFO Revision Age at Perceptual Map (at end of this year) Date Revision Cost 20 Apple 6.4 13.8 18000 24-Dec-23 2.0 $2995 Ate 8.5 13.8 16000 23-Dec-22 3.5 $1990 16 11.3 2.5 $2723 14 Attic 6.6 18000 17-Sep-23 12 Alan 13.6 8.9 20000 21-Nov-22 1.5 $1901 N 10 NA 0.0 0.0 SO NA 0.0 0.0 NA 0.0 0.0 SO NA 0.0 0.0 4 6 8 10 12 14 16 18 20 Total $9609 Performance Material Cost Age Profile O 7.5 Apple 7.16 15.98 51.... . ...... Ate 16.2 Attic 10 Perceived Age in Years 11.67 Alan 15.29 2.5 12.98 So $2.5 $5 $7.5 $10 $12.5 $15 $17.5 Material Cost in dollars New Material Cost Old Material Cost Apple .+ Ate . Attic . Alan MacBook Air F2 20 FS 888 FA .. FS -2- F6 F7 II FB F10 45)) FVZ @ & 6 Q W E R U O P S D F G H K Z X C V B N M 96 alt command command optionTOM Initiative Teamname: Andrews | Round: 1 | Year: 20 Recalculate Draft saved at May 04, 2021 04:02PM ED Process Management Initiatives Projected Impact Budget ($000) CPI Systems Total Current Expenditures ($000) : $0 Vendor/ JIT $ Projected Cumulative Impacts Worst Case Best Case Quality Initiative Training O Material Cost Reduction 0.0% 0.0% Channel Support Systems O Labor Cost Reduction 0.0% 0.0% Concurrent Engineering Reduction R&D Cycle Time 0.0% 0.0% UNEP Green Programs Reduction in Admin Costs 0.0% 0.0% Benchmarking O Demand increase 0.0% 0.0% Quality Function Deployment Effort CCE/6 Sigma Training GEMI TQEM Sustainability Initiatives Reduction in Cost of Goods Admin Cost Reductions R&D Cycle Time Reductions Demand Increase For the Year Just Ended For the Year Just Ended For the Year Just Ended For the Year Just Ended Andrews Andrews Andrews Baldwin Baldwin Baldwin Chester 0 Cheste Chester Chester Digby Digby Digby Digby MacBook Air 30 F1 28 F2 20 F3 888 FA - FS F7 I FB F9 W # 5 Q W E R O P 4 S D F G H K Z X C V B N M alt command command opticBalance Sheet Survey Andrews Baldwin Chester $32,551 Cash $32,226 $17,478 Accounts Receivable $13,447 $9,837 $10,838 Inventory $25,680 $16,975 $10, 144 Total Current Assets $71,353 $44,290 $53,532 Plant and equipment $96,824 $84,380 $142,900 Accumulated Depreciation $44,409 ($35,023) ($51,267) Total Fixed Assets $52,415 $49,357 $91,633 Total Assets $123,768 $93,647 $145, 165 Accounts Payable $9,516 $6,601 $7,198 Current Debt $15,717 $18,440 $29,274 $25 , Total Current Liabilities $25,23 $25,041 $36.472 $31 , Long Term Debt $27,209 $19,475 $53,923 $41 , 3 Total Liabilities $52,44 $44,516 $90,395 $72,6 Common Stock $12,081 $9,099 $24,674 $14,3 Retained Earnings $59,244 $40,032 $30,096 $38,76 Total Equity $71,32 $49,131 $54,770 $53,15 Total Liabilities & Owner's Equity $123,768 $93,647 $145,165 $125,80 A Income Statement Survey Andrews Baldwin Digby Sales $163,60 $119,68 $131,859 $118,679 Variable Costs (Labor, Material, Carry) $107,721 $80,332 $87,337 $72,634 Contribution Margin $55,BBB $39,350 $44.522 $46.045 Depreciation $6,455 $5.625 $9.527 $8,293 SGA (R&D, Promo, Sales, Admin) $12,835 $12.318 $12.657 $13,265 Other (Fees, Writeoffs, TOM, Bonuses $29 $311 $479 $780 EBIT $36,569 $21,096 $21,85 $23,707 Interest (Short term, Long term) $4,850 $4 246 19,978 Taxes $7,749 $11,101 $5,898 $4,158 Profit Sharing $5.585 $412 $219 Net Profit $207 $20,205 $10,734 $7,568 $10. 16 Digby 00 Digby Digby Digby MacBook Air esc :9 F1 2 F2 20 F3 888 FA FS -2. F6 14 F7 I FB W # A LA * Q W E R O P A S D G H K . .. Z X C B N M alt alt option command command optionBond Market Summary Close$ S&P Face Yield Series# Company Andrews 13.582022 $11,300,000 13.0% 103.58 $8,837,000 11.3% 99.07 11.282027 102.54 11.982028 $7,072,000 11.6% Baldwin 13.2% 102.54 13.58202 $11,300,000 11.182029 $2,507,689 11.7% 95.21 11.7% 95.48 11.252030 $5,667,039 Chester $11,300,000 13.5% 100.17 13.582022 $10 417,600 12.4% 90.83 11.382027 $14,665,611 13.1% K.74 2.582028 12.582029 $7,969,218 13.1% 95.45 12.582030 $9,570,210 13.1% 95.19 Digby $11,300,000 100.67 13.582022 13.4% CC 11.282027 $8,635,154 12.2% 91.62 CC 12.8% 96.65 cc 12.482028 $5,826,767 11.982030 $ 15,600,517 12.7%% 93.51 Next Year's Prime Rate 8% Page COMP-XM@ INQUIRER Digby Digby Digby Digby MacBook Air esc 19 F1 :2 F2 20 3 888 FA -. FS -2. F6 44 F7 II FB FO 4 F10 W# delete w G W E R T U O P tab A S D F G H K . . s lock Z X C N M alt 96 alt trol option command command optionComp-XM - Inquirer Report ww5.capsim.com/compxm/inquirer#financial-statistics 0 1,500 1,750 2,000 2,250 2,500 2,750 3,000 3,250 3,500 3,750 4,000 4,250 4,500 4,750 5,000 5,250 5,500 5,750 6,0 250 500 750 1,000 1,250 Capacity Production Chester Baldwin Andrews 5,891 3,416 5,594 Units Produced Production Information Automation Next Round Capacity Next Round Pla Name Primary Segment Units Sold Unit Inventory Revision Date Age Dec.31 MTBF Pfmn Coord Size Coord Price Material Cost Labor Cost Contr. Marg. 2nd Shift & Overtime 22% 4.0 714 13.2 9.2 $42.00 $16.81 $9.80 36% 1,130 Elite 773 215 11/13/2020 1.1 26000 33% 90% Apple 14.5 $26.00 $8.13 $7.90 1,200 1,372 57 4/13/2018 5.1 20000 $8.96 35% 50% 5.0 Ato Thrift 11.8 $32.00 $11.60 12/10/2019 2.2 22000 RA 33% 42% 4.0 728 Attic Core 1.832 7.2 $40.00 $16.13 $10.29 63 1/8/2020 1.1 24000 570 Alan Nano 922 93% 5.0 9.0 $30.00 $13.98 $9.50 25% Nano 1,129 84 11/11/2020 2.2 23000 9.4 5.0 700 Beetle 9.8 $38.00 $7.73 0% 144 12/12/2020 1.9 25000 26 $15.87 41% 33% 5.0 A 850 Bill Elite 436 $8.65 10 7.2 $37.00 $15.79 33% 261 12/21/2020 1.0 23000 13% 5.0 950 Boat Nano 960 $16.39 $8.14 36% Elite 865 239 12/4/2020 .0 25000 13.0 9.2 $39.00 Best 1,050 $8.40 41% 8.0 $4.03 33% 13.4 $19.00 Cent Thrift 1.341 233 12/10/2020 2.8 17000 68 57% 8.0 1,250 2.6 17000 70 13.2 $19.00 $8.61 $4.2 37%% 1.675 280 12/18/2020 900 Clack Thrift 6.0 94 10.4 $27.00 11.68 $7.38 30% 93% Coat Core 1,29 146 12/2/2020 .2 18000 $12.39 $7.33 30% 87% 6.0 950 185% .2 20000 101 10.9 $28.00 Creak Core 1,418 81 1/18/2020 100% 9.0 1,000 198% 3.5 14000 14.2 $20.00 $6.65 Deft 1,725 22 6.0 $2.82 51% Thrift 6/28/2021 31% 100% 7.0 1,150 198% 14 1/29/2020 2 16000 8.6 11.6 $22.00 $10.01 $5.64 Core 1.879 124% Dim 36% 25% 6.0 750 161 12/21/2020 .1 18000 10.5 7.9 $31,00 $13.64 $6 24 800 107% Don Nano 700 12.5 $14.36 $7 09 38 Drum Elite 605 134 11/4/2020 1.1 20000 9.7 $35,00 Page 4 COMP-XM@ INQUIRER Digby Digby Digby Digby MacBook Air esc :9 F1 19- F2 20 FS 888 FA - FS - - F6 44 F7 II FB F10 4)) FVZ @ 2 W# A LA 8 Q W E R Y O P A S D . . F G H K . . Z X C B N M alt alt tion command command optionute Everyda... Jennifer Lopez int... @ Content . How Jessica Vosk... Lake Erie Algae BI... Acid Rain Facts # x^3+x^2+x+6 - W... "> Other Bookmark comp.xm. File * Undo Decisions Proformas Reports * Help Recalculate Finance Teamname: Andrews | Round: 1 | Year: 2021 Draft saved at May 04, 2021 04:02PM EDT Finances Liabilities & Owner's Equity Plant Improvements Accounts Payable : 8 % Total Investments ($000) $0 Current Debt : 0.2% Sales of Plant & Equipment - Long Term Debt : 24.6 % Common Stock Shares Outstanding (000) 2,051 Retained Earnings : 56.3% - Price Per Share O $95.71 Common Stock : 10.9% Earnings Per Share $ 1.50 Max Stock Issue ($000) $ 39,260 Long Term Debt Issue Stock ($000) $ Retire Long Term Debt ($000) $ Max Stock Retire ($000) $9,815 Issue Long Term Debt ($000) Retire Stock ($000) $ Long Term Interest Rate ( 11.4% Maximum Issue This Year $ 14,722 Dividend Per Share O $ 0.00 Current Debt A/R Lag (days) 30 Interest Rate 10.0% A/P Lag (days) 30 Due This Year $ 15,717 Outstanding Bonds Borrow ($000) Series Number ( Face Amount Current Yield ) 2020 Close Cash Positions 13.552022 $ 11,300 13.0% $ 103.58 December 31, 2020 11.3% $ 32,226 11.252027 $ 8,837 $ 99.07 11.952028 $ 7,072 11.6% $ 102.54 December 31, 2021 ( ($ 218) MacBook Air :9 F1 F2 20 FS. 888 FA - FS F7 % A W * 5 Q W E R Y O P 4 S D F G H K Z X B N M alt command command optionDigby Selected Financial Statistics Andrews Baldwin Chester 5.7% 12.3% 9% ROS 1.32 1.28 0.91 Asset Turnover 16.3% 11.5% 5.2% ROA 2.7 17 19 Leverage (Assets/Equity) 28.3% 21.8% 13.89 ROE SO SO SO Emergency Loan $163,608,638 $119,682,208 $131,858,762 Sales $36,568,511 $21,096,446 $21,858,788 EBIT $20,204,718 $10,733,913 $7,568,210 Profits SO Cumulative Profit 78% 10.3 9.6% SG&A / Sales 34.2% 32.9% 33.8% Contribargin % Percent Of Sales $ Market Share 125% 22.2 % Andrews 100% 30.7 % Digby Digby Digby Digby MacBook Air esc :9 F1 29- F2 20 F3 888 F4 FS -2 F6 4 F7 II FB F10 % 7 5 & 6 8 Q W R O P A S D F G H K . . Z X C B N M alt alt ption command command optionDraft saved at May 04, 2021 04:01PM Production Total Schedule O Apple Ate Attic Alan NA NA NA NA 852 923 2,457 0 D 0 0 4,89 Unit Sales Forecast O O O 1,27 Inventory On Hand 215 757 44 263 5,650 Production Schedule 750 2150 1800 950 O Production After Adj. 2,129 1,782 941 0 5,59 743 Margins 2nd Shift Production% 5.1% 90.3% 50.0% 30.5% 0 $9.67 $8.28 $9.39 $10.50 ooo Labor Cost/Unit O Material Cost/Unit $15.98 $6.00 $10.00 $15.29 Total Unit Cost $25.65 $14.28 $19.39 $25.79 Contribution Margin ($ 1)% 2.9% 44.6% 29.3% Total Physical Plant 714 1,130 1,200 728 0 0 O 3,772 1st Shift Capacity Buy/Sell Capacity 0 0 4.0 6.0 5.0 4.0 0.0 0.0 0.0 0.0 Automation Rating New Autom. Rating 4.0 6.0 5.0 4.0 Investment ($000) $0 $0 $0 $0 $0 $0 $0 $0 Needed 1st Shift 2nd Shift ) Max Invest () Last Year This Year % This Year Overtime $ 59,760 Workforce 804 552 252 0.0% A/P Lag O) 30 Complement 804 804 100 % Production vs Capacity Price vs Unit Cost 3k $40 MacBook Air 20 F3 888 FA FS -2- F6 14 F7 IS FB 39 F1 38 F2 W# 6 O P Q W E H K 4 S D G Z X C V B N M 96 command commandRecalculate MR Human Resources Teamname: Andrews | Round: 1 | Year: 2021 Draft saved at May 04, 2021 04:02PM EDT Staffing Labor Negotiations Last Year This Year Current Labor Negotiation Negotiation Contract O Demands O Position Position Needed Complement O 804 304 Starting Ceiling 100% 1009 Hourly Complement % $ 28.08 Wage $25.53 $28.08 $ 25.53 Complement O 804 804 Benefits $ 2,500 $ 2,750 $ 2,500 $ 2,750 Profit 1st Shift Complement O 525 552 2.0% 2.2% 2.0% 2.2% Sharing % 2nd Shift Complement O 279 252 Annual 5.0% 5.5% 5.0% 5.5% Raise Overtime% O 0.0% 0.0% Contract Expiration: 1-Oct- 2025 Turnover Rate 10.0% 10.0% New Employees O 140 80 Separated Employees 0 Recruiting Spend $ Training Hours O Productivity Index 100.0% 100.0% Recruiting Cost $80 Separation Cost SO Training Cost SO Total HR Admin Costs $80 CAPSIM Z Phone: 877-477-8787 | Email: support@capsim.com | Address: 2012 Corporate Lane, Su 108 Naperville, IL. 60563 MacBook Air :9: F1 F2 20 F3 888FA . FS F7 - 11 FB @ % & Q W E R T O P A S D F G H K Z X B N M alt command command optionHilary Helsley Dec. 31 2020 Stocks & Bonds INQUIRER Stock Market Summary Book Value Per Share EPS Dividend Yield Company Close Change Shares MarketCap($M) 6.8% $196 $34.78 $9.85 $6.50 Andrews $95.71 $15.19 2,051,031 $25.73 $2.35 Baldwin $6.26 1,909,747 $105 $5.62 4.3% $54.98 $115 $21.35 $2.95 $4.89 10.9% Chester $44.72 $1.11 2,565,751 $10.83 2,173,111 $116 $24.46 $4.68 $2.89 5.4% Digby $53.16 Closing Stock Price Andrew + Baldwin - Chester $100 Digby . Andrews: 95.71 $80 $60 $40 $20 Digby Digby Digby 00 MacBook Air esc 20 F3 888 FA FS I FB ON Q W E R O P S D F G H K Z X C B N M pit alt option command command optionTeamname: Andrews | Round: 1 | Year: 202 Recalculate M Marketing Draft saved at May 04, 2021 04:01PM EDT Your Contrib Sales Benchmark Gross Variable Less Name Price Promo Budget O Revenue O Costs @ Promo/Sales ) Budget Prediction Forecast Margin 659 $ 16,807 $ 16,903 $- 96 ($ 2,496 Apple $ 25.50 $ 1200 $ 1200 $ 9,131 $ 6,731 Ate $ 25.00 $ 1200 852 $ 12, 160 1200 $ $ 21,292 35.00 1200 $ 1200 923 0 $ 32,312 $ 17,900 $ 14,412 $ 12,012 Attic $ $ 2,457 0 $ 89,677 $ 63,367 $ 26,310 $ 23,910 Alan 36.50 $ 1200 1200 $0 $0 $ 0 $0 $0 NA $0.0 $0 NA $0.0 $0 0 $0 $0 $0 $0 $0 NA $0.0 $0 $0 $0 $0 $0 $0 $ $0 NA $0.0 Total $ 4,800 $ 4,800 4,891 o $ 160,087 $ 110,330 $ 49,757 $ 40, 157 A/R Lag (days) : 30 A/P Lag (days) : 30 Revenue Forecast Unit Sales Forecast 100 $89,677 2,457 Unit Sales forecast (in 000's) Revenue forecast (in 000's) 50 $32,312 852 923 $19,303 $21,291 659 Apple Ate Attic Alan Apple Attic Alan Variable Cost Marketing Margin After Marketing Thrift Core Nano Elite MacBook Air SC :9 F1 95 F2 80 F3 888 F4 F7 1 FB F9 F10 45)) FV2 W# 6 W E R O P 4 S D F G H K Z X C B N M 9:6 alt command command option