

Question: READING AND INTERPRETING GRAPHICS Read and interpret the graphic to answer the following questions. Circle the letter of the best answer. E-Z Univ. Top Coll
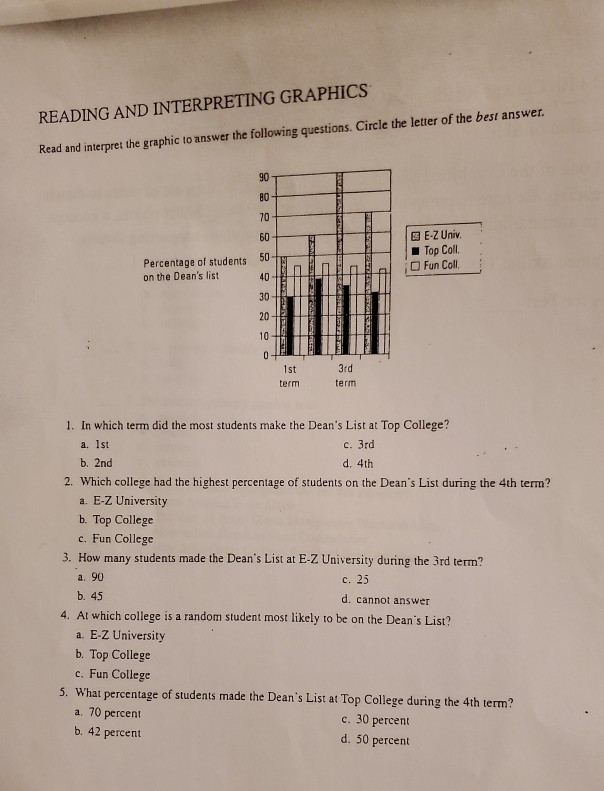
READING AND INTERPRETING GRAPHICS Read and interpret the graphic to answer the following questions. Circle the letter of the best answer. E-Z Univ. Top Coll Fun Coll Percentage of students on the Dean's list Det ende 1st term 3rd term 1. In which term did the most students make the Dean's List at Top College? a. Ist c. 3rd b. 2nd d. 4th 2. Which college had the highest percentage of students on the Dean's List during the 4th term? a. E-Z University b. Top College c. Fun College 3. How many students made the Dean's List at E-Z University during the 3rd term? a. 90 c. 25 b. 45 d. cannot answer 4. At which college is a random student most likely to be on the Dean's List? a. E-Z University b. Top College c. Fun College 5. What percentage of students made the Dean's List at Top College during the 4th term? a. 70 percent c. 30 percent b. 42 percent d. 50 percent
Step by Step Solution
There are 3 Steps involved in it

Get step-by-step solutions from verified subject matter experts