

Question: Reading Test Score2 Reading Test Score Scatterplot A 850 140 82.5 800 77.5 750 10 Scatterplot B 97.5 950 92.5 90.0 87.5 10 85.0
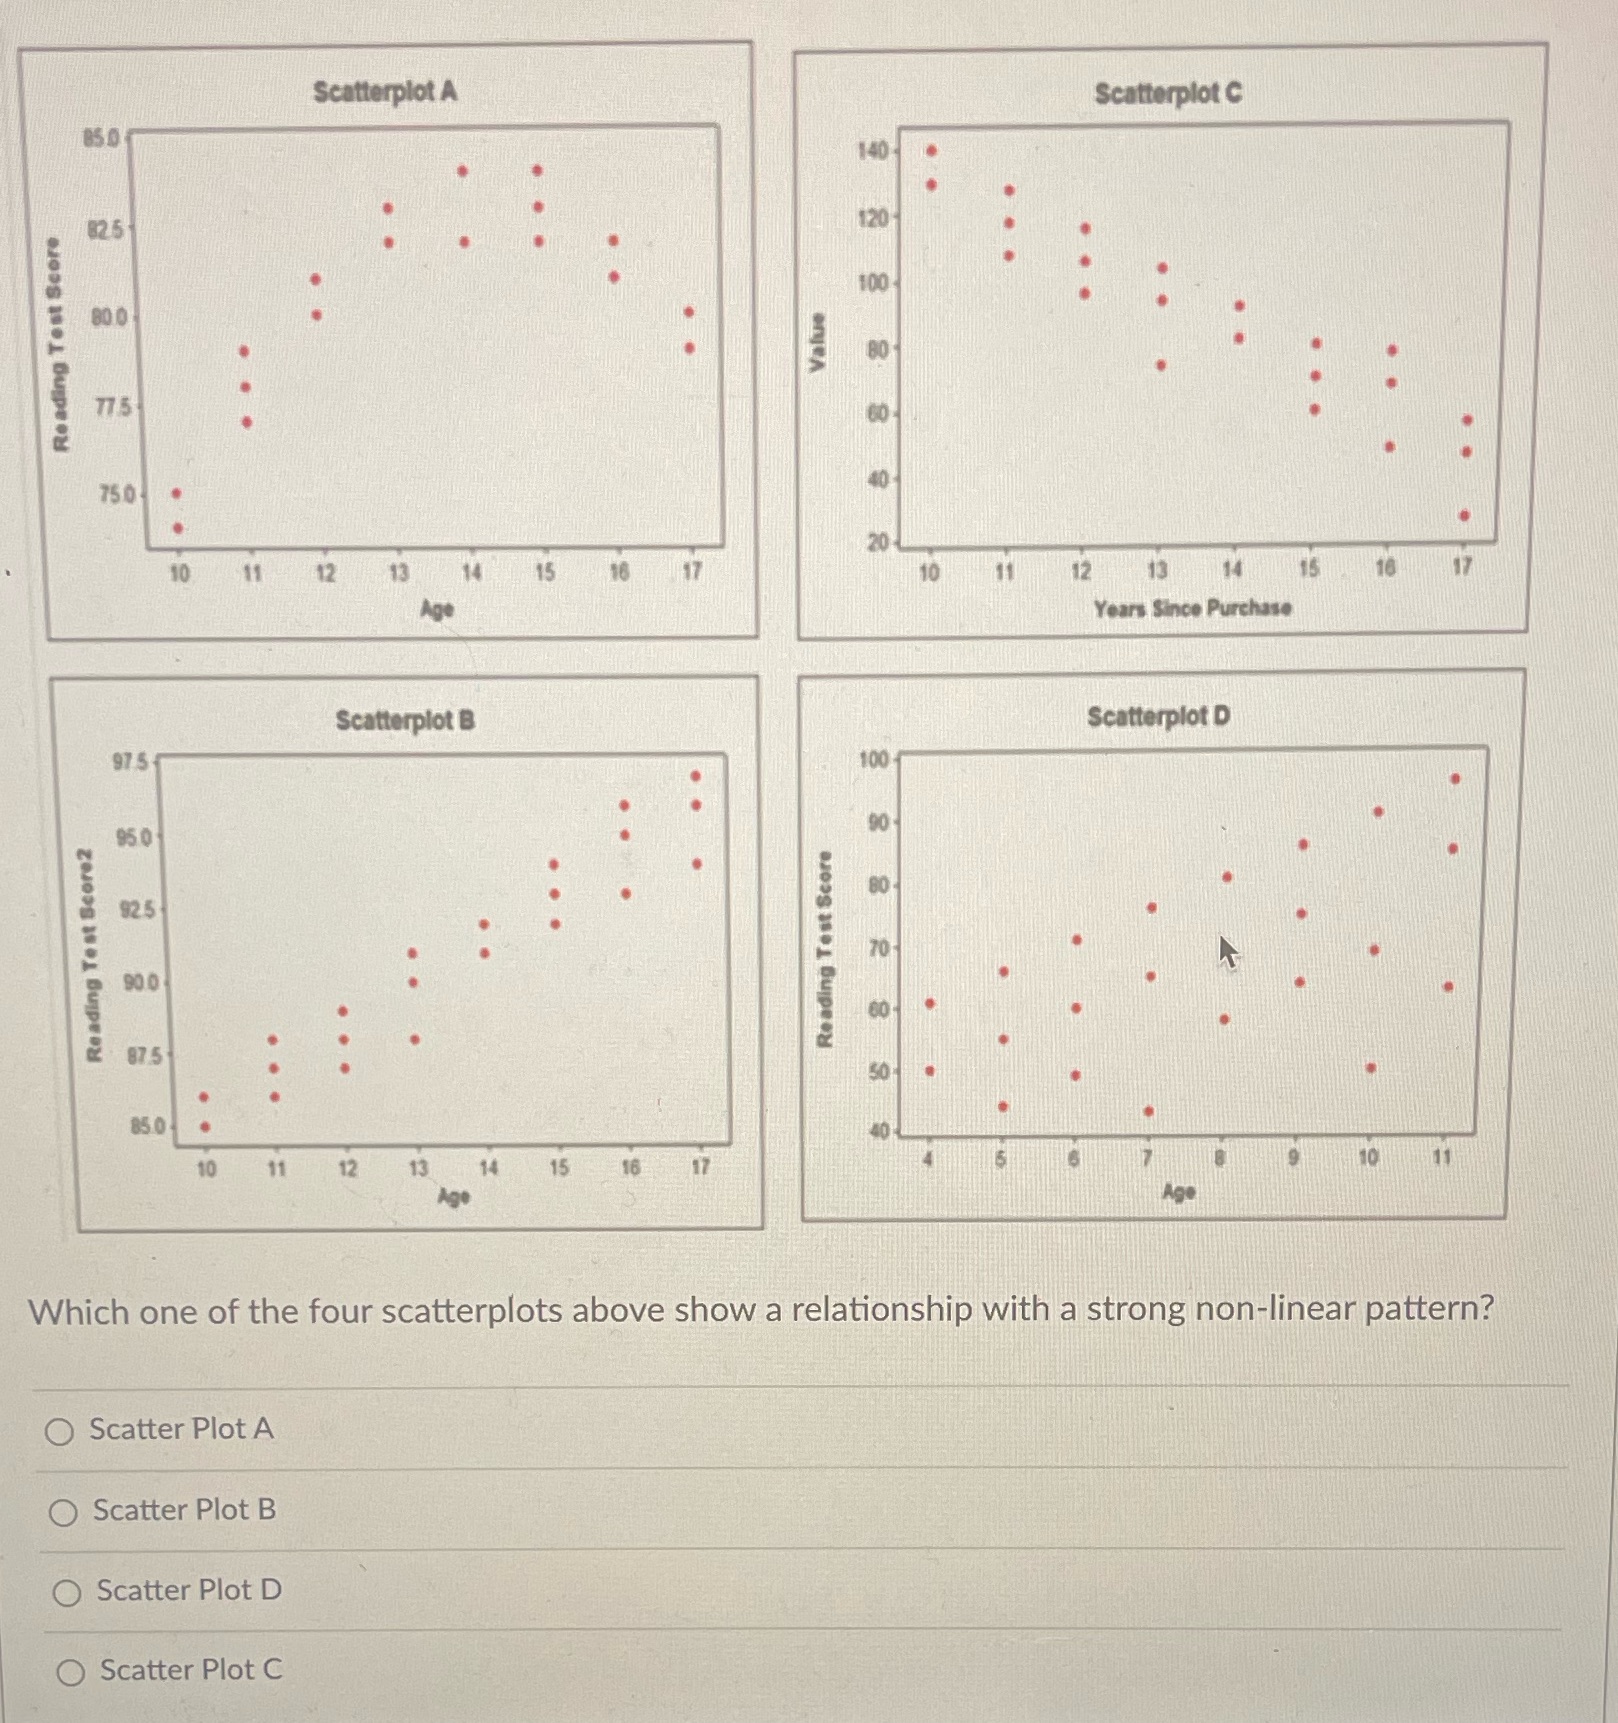
Reading Test Score2 Reading Test Score Scatterplot A 850 140 82.5 800 77.5 750 10 Scatterplot B 97.5 950 92.5 90.0 87.5 10 85.0 10 11 12 13 14 15 17 Age Value 120 100 8 800 8 Scatterplot C 12 13 14 16 17 Years Since Purchase Scatterplot D 100 90 Reading Test Score 8 2 8 Age Which one of the four scatterplots above show a relationship with a strong non-linear pattern? O Scatter Plot A Scatter Plot B Scatter Plot D Scatter Plot C
Step by Step Solution
There are 3 Steps involved in it
1 Expert Approved Answer
Step: 1 Unlock

Question Has Been Solved by an Expert!
Get step-by-step solutions from verified subject matter experts
Step: 2 Unlock
Step: 3 Unlock