

Question: REAL NUMBERS FOR REAL BANKS Continuing Case Assignment for Chapter 5 FIRST LOOK AT YOUR BHC'S FINANCIAL STATEMENTS In Chapter 5, we focus most heavily
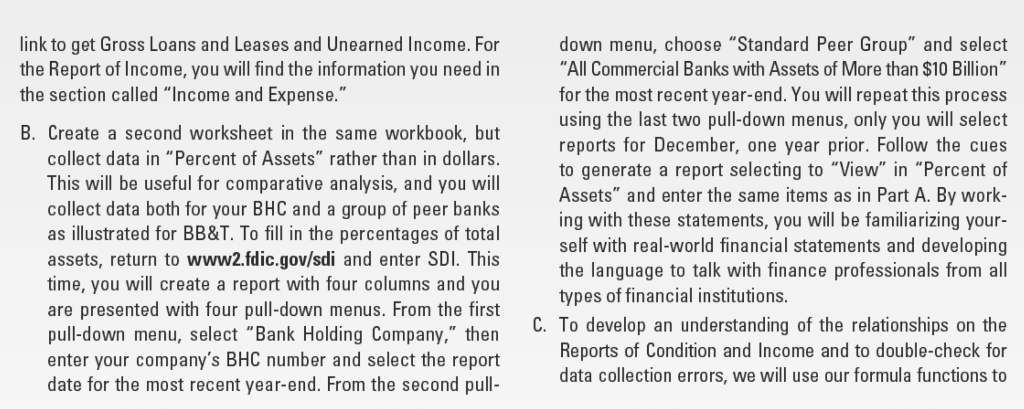
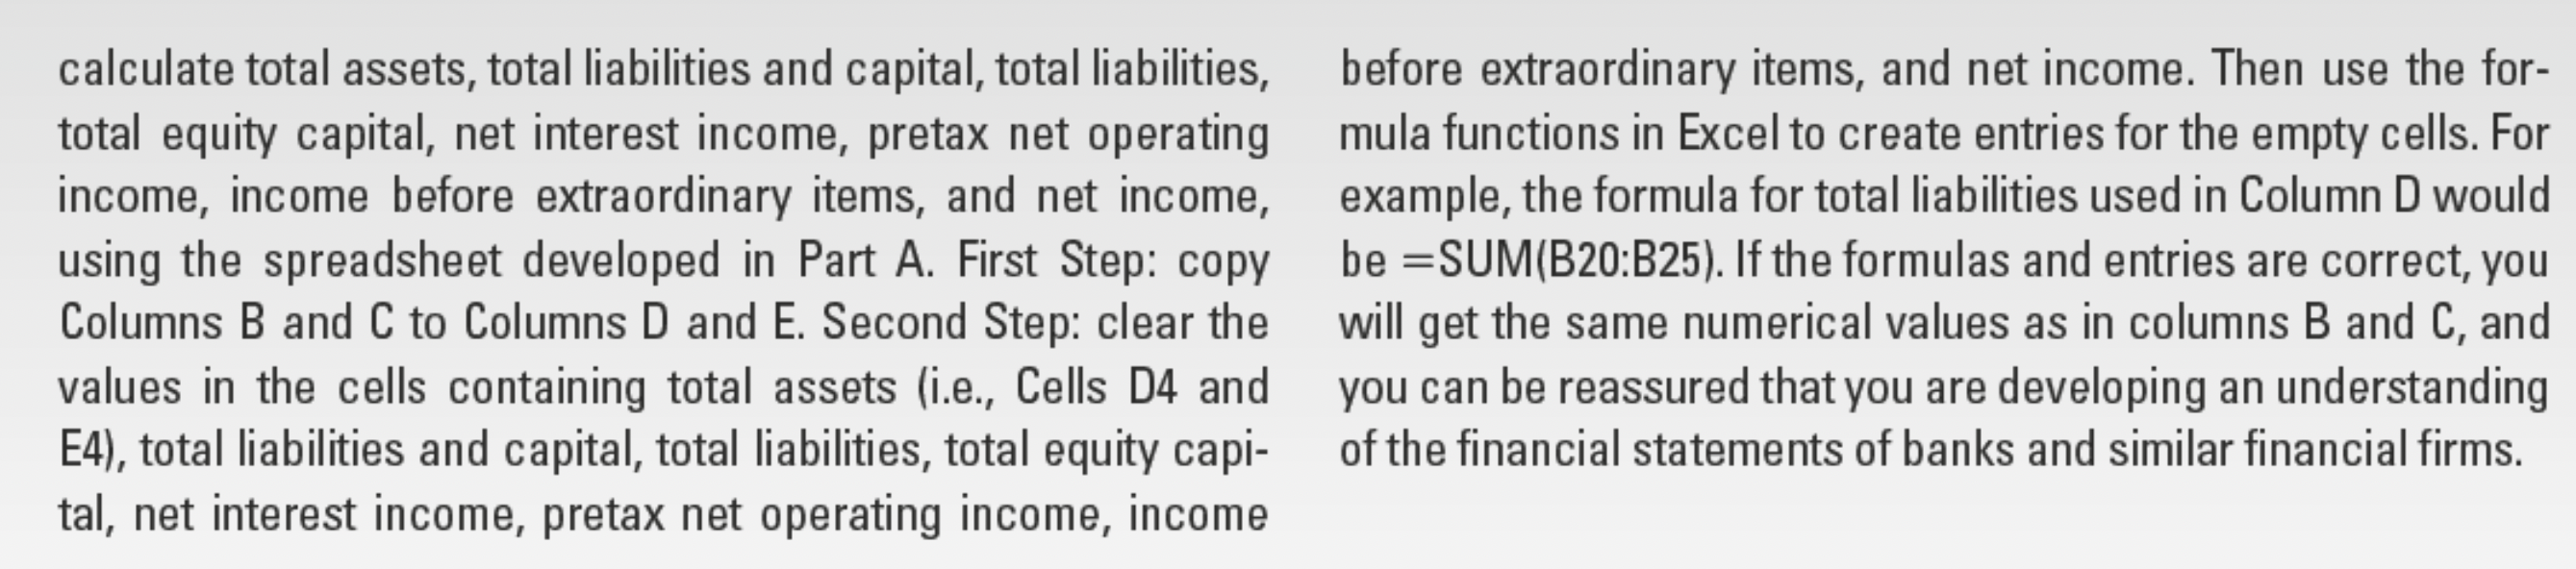
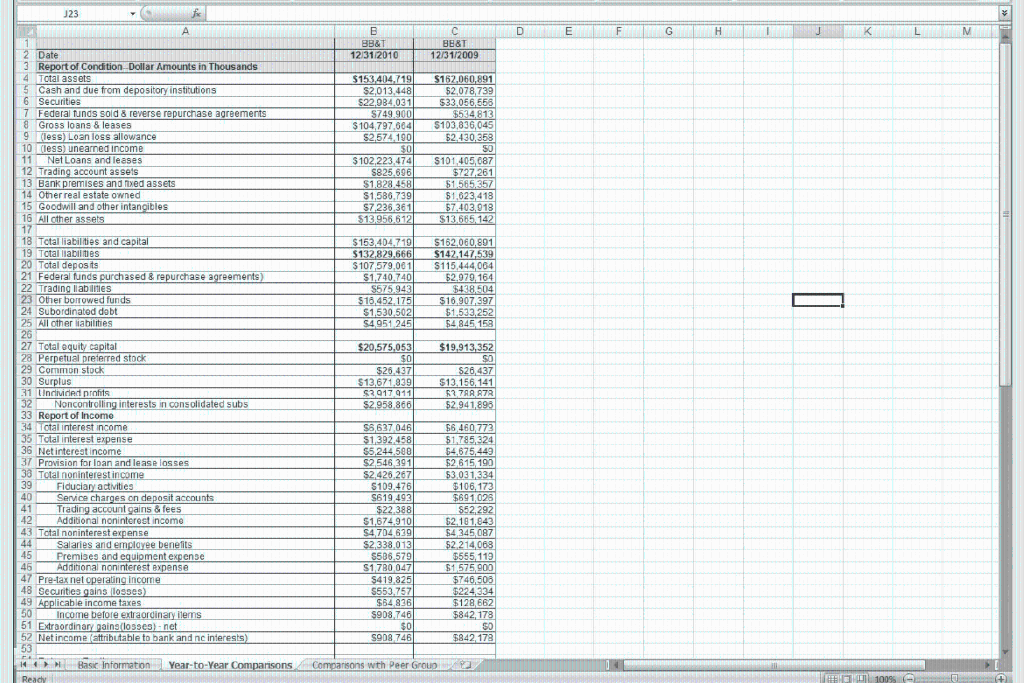
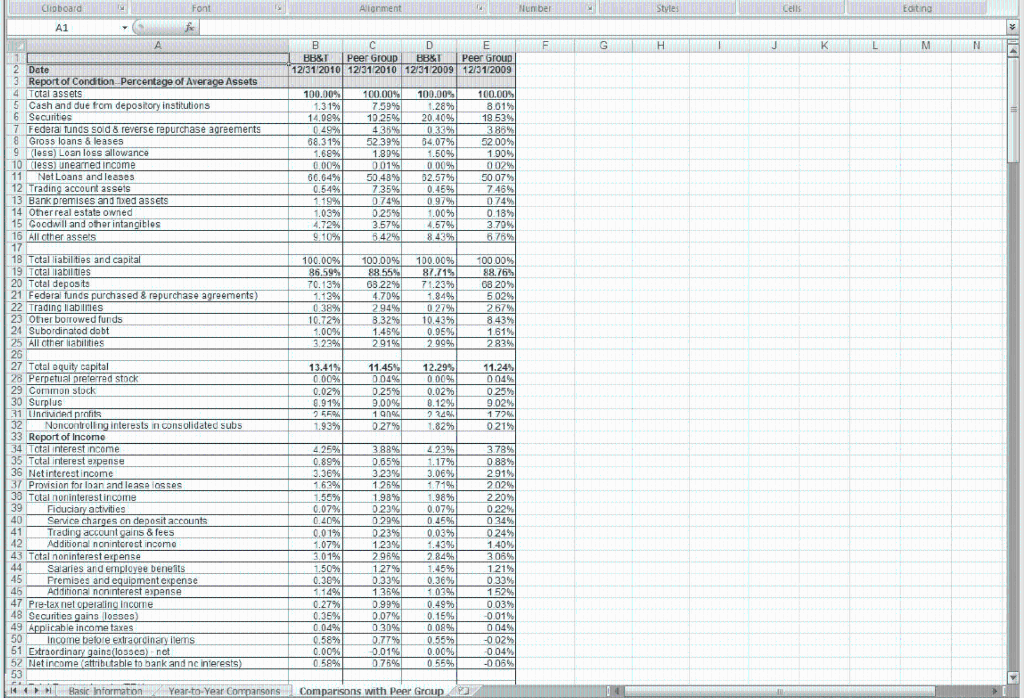
REAL NUMBERS FOR REAL BANKS Continuing Case Assignment for Chapter 5 FIRST LOOK AT YOUR BHC'S FINANCIAL STATEMENTS In Chapter 5, we focus most heavily on the financial statements for banking companies. As you read this chapter, you progress through a lengthy, yet interesting, discussion of the items found on the Report of Condition (balance sheet) and the Report of Income (income statement). In the chapter you find financial statements providing dollar amounts and then comparative financial statements where the ratios of items-to-assets are presented. The data was collected from Statistics for Deposi- tory Institutions at the FDIC's website (www2.fdic.gov/sdi/) and organized into tables using Excel. You will first create financial statements using dollar figures collected from SDI for your banking company for year-to-year comparisons, and you will then create financial statements for your banking company and its Peer Group using the ratios of items-to-assets. A. Add a spreadsheet entitled "Year-to-Year Comparisons" to your Excel workbook. Enter the data for your BHC in the format illustrated for BB&T. To fill in the dollar amounts for the Year-to-Year Compari- sons spreadsheet, go to www2.fdic.gov/sdi and enter SDI. You will create a report with two columns and you are pre- sented with two pull-down menus. From the first pull-down menu, select "Bank Holding Company," then enter your com- pany's BHC number, and select the report date for the most recent year-end. From the second pull-down menu, repeat the process, only you will select reports for December, one year prior. Follow the cues to generate a report selecting to "View" in "Dollars" for the first spreadsheet. For the Report of Condition you will be able to enter most data directly from the Assets and Liabilities report generated at the FDIC website; however, you will have to explore the Net Loans and Leases link to get Gross Loans and Leases and Unearned Income. For the Report of Income, you will find the information you need in the section called "Income and Expense." B. Create a second worksheet in the same workbook, but collect data in "Percent of Assets" rather than in dollars. This will be useful for comparative analysis, and you will collect data both for your BHC and a group of peer banks as illustrated for BB&T. To fill in the percentages of total assets, return to www2.fdic.gov/sdi and enter SDI. This time, you will create a report with four columns and you are presented with four pull-down menus. From the first pull-down menu, select "Bank Holding Company," then enter your company's BHC number and select the report date for the most recent year-end. From the second pull- down menu, choose "Standard Peer Group" and select "All Commercial Banks with Assets of More than $10 Billion" for the most recent year-end. You will repeat this process using the last two pull-down menus, only you will select reports for December, one year prior. Follow the cues to generate a report selecting to "View" in "Percent of Assets" and enter the same items as in Part A. By work- ing with these statements, you will be familiarizing your- self with real-world financial statements and developing the language to talk with finance professionals from all types of financial institutions. C. To develop an understanding of the relationships on the Reports of Condition and Income and to double-check for data collection errors, we will use our formula functions to calculate total assets, total liabilities and capital, total liabilities, before extraordinary items, and net income. Then use the for- total equity capital, net interest income, pretax net operating mula functions in Excel to create entries for the empty cells. For income, income before extraordinary items, and net income, example, the formula for total liabilities used in Column D would using the spreadsheet developed in Part A. First Step: copy be =SUM(B20:B25). If the formulas and entries are correct, you Columns B and C to Columns D and E. Second Step: clear the will get the same numerical values as in columns B and C, and values in the cells containing total assets (i.e., Cells 14 and you can be reassured that you are developing an understanding E4), total liabilities and capital, total liabilities, total equity capi- of the financial statements of banks and similar financial firms. tal, net interest income, pretax net operating income, income J23 D E F G H J L M B BB&T 12/31/2010 BE&T 12/31/2009 $153,404,719 $2,013,448 $22.984.031 S749.900 $104,797,664 $2,574,190 $0 $102,223,474 $825.696 $1.828.458 $1,586,739 $7.236.361 $13.956,612 $162,060,891 $2,078,739 $33,056,558 $534,813 $103,836,045 $2.430,358 50 $ 101,405,087 $727,261 $1565357 $1,623.418 57,403,013 $13,665 142 $153,404.710 $132,829,566 $ 107,579,061 $1,740,740 $575.943 $16,452 175 $1,530,502 S4951 245 $162.060,891 $142.147.539 $115,444,064 52,979,164 $438.504 $16.907,397 $1,533,252 $4845, 158 - A 1 2 Date 3 Report of Condition-Dollar Amounts in Thousands 4 Total assets 5 Cash and due from depository institutions 6 Securities 7 Federal funds sold & reverse repurchase agreements 8 Gross loans & leases 9 (less Loan loss allowance 10 (less) unearned income 11 Net Loans and leases 12 Trading account assets 13 Bank premises and fixed assets 14 Other real estate owned 15 Goodwill and other intangibles 16 All other assets 17 18 Total liabilities and capital 19 Total liabilities 20 Total deposits 21 Federal funds purchased & repurchase agreements) 22 Trading liabilities 23 Other borrowed funds 24 Subordinatod dobt 25 All other liabilities 26 27 Total equity capital 28 Perpetual preferred stock 29 Common stock 30 Surplus 31 Undivided profits 32 Noncontrolling interests in consolidated subs 33 Report of Income 34 Total interest income 35 Total interest expense 36 Net interest income 37 Provision for loan and lease losses 38 Total noninterest income 39 Fiduciary activities 40 Service charges on deposit accounts 41 Trading account gains & fees 42 Additional noninterest income 43 Total noninterest expense 44 Salaries and employee benefits 45 Premises and equipment expense 45 Additional noninterest expense 47 Pre-tax net operating income 48 Securities gains losses) 49 Applicable income taxes 50 Income before extraordinary items 51 Extraordinary paina dosegnet 52 Net income attributable to bank and no interests) 53 N Basic Information Year-to-Year Comparisons - Ready $20,575,0531 $0 $26.437 $13,671 939 $3017011 $2.958.866 $19,913,352 SO $26,437 $13.156.141 $37AA AR 52.941,893 $6,637 0461 $1.392.458 $5,244,500 $2,546 391 $2,426.267 $109.476 S619 493 $22,388 $1,674 910 S4 704 639 $2,338,013 55B6,579 $1.7B0 047 $419.825 5553,757 $64.836 $ $908,746 $0 S908 746 $6 460 773 $1,785,324 54,675,449 $2615, 190 53.031.334 $106.173 $691 028 $52,292 $2.181.643 $4 345,087 $2 214,063 5555,119 $1,575,000 $746,505 $224334 $128.662 $842 178 50 $842178 Comparisons wth Peer Group 1009 Clipboard Font Allarment Number Styles Cells Editing A1 F G H TJ K L M N A B C D E 17 BB&Peer GroupBB&T T &T Peer Group 2 Date 12/31/2010 12/31/2010 12/31/2009 12/31/2009 3 Report of Condition-Percentage of Average Assets 4 Total assets 100.00% 100.00% 100.00% 100.00% 5 Cash and due from depository institutions 1.31% 7.59% 1.28% 8.01% 6 Securities 14.09% 10.25% 20.40% 19 53% 7 Federal funds sold & reverse repurchase agreements 0.49% 435% 0.33% 3.86% 8 Gross loans & leases 68.31% 52.39% 04.07% 5200% 9 (less) Loan loss allowance 1.68% 1.8096 1.50% 1.90% 10 less, unearned income 0.00% 001% 0.00% 0 02% 11 Not Loans and leases 66.6498 50.48% 32.57% 50.07% 12 Trading account assets 0.54% 7.35% 0.45% 7.46% 13 Bank premises and fixed assets 1.19% 0.74% 0.97% 074% 14 Other real estate owned 1.03% 0.25% 1.00% 0.18% 15 Coodwill and other intangibles 4.72% 3.57% 4.57% 3.70% 16 All cher assets 9.10% 5.42% 843% 6.78% 17 18 Total liabilities and capital 100.00% 100.00% 100.00% % 100.00% 19 Total abilities 86.59% 88.55% % 87.71% 88.76% 20 Total deposits 70.13% 68.22% 71.23% 08 209 21 Federal funds purchased & repurchase agreements) 1.13% 4.70% 1.849 5029 22 Trading liabilmes 0.38% 294% 0.27% 267% 23 Other borrowed funds 10.72% 8.32% 10.43% 8 43% 24 Subordinatod dobt 1.00% 1.46% 0.95% 1.61 25 All other liabilities 3.23% 2.91% 2.99% 2 83% 26 27 Total oquity capital 13.41% 11.45% 12.29% 11.24% 28 Perpetual preferred stock 0.00% 0.04% 0.00% 004% 29 Common stock 0.02% 0.25% 0.02% 0.25% 30 Surplus 8.91% 9.00% 8.12% 902% 31 Uncinded profits 95% 19% 2340% 1729 32 Noncontrolling interests in consolidated subs 1.93% 0.27% 1.82% 0 21% 33 Report of Incomo 34 Total interest income 4.25% 3.88% % 4.23% 378% 35 Total interest expense 0.89% 0.65% 1.17% 0 88% 36 Net interest income 3.36% 3.23% 3.0696 291% 37 Provision for loan and lease lastes 1.63% 12596 202% 30 Total non interest income 1.55% 1.98% 1.98% 220% 39 Fiduciary activities 0.07% 0 23% 0.07% 022% 40 Service charges on deposit accounts 0.40% 0.29% 0.45% 0 34% 41 Trading account gains & fees 0.01% 023% 0.03% 0 24% 42 Additional noninterest incomo 1.079 1.23% 1.4396 1.40% 43 Total noninterest expense 3.01% % 2.96% 2.84% 3.06% 44 Salaries and employee beneits 1.50% 1.27% 1.45% 121% 45 Premises and equipment expense 0.38% 0.33% 0.36% 0.33% 45 Additional noninterest expense 1 14% 1.3696 1.03% 1 52% 47 Pre-tax net operating Income 0.27% 0.99% 0.49% 003% 48 Securities gains 105305) 0.35% 0.07% 0.15% -0.01% 49 Applicable income taxes 0.04% 0.30% 0.08% 004% 50 Income before extraordinary Items 0.58% 0.77% 0.55% -0.02% 51 Extraordinary gainalooco) not 0.0096 0.0196 0.0096 0.04% 52 Net income attributable to bank and ne interests) 0.58% 0.76% 0.55% -0.06% 53 Basic Information Year-to-Year Comparsons Comparisons with Peer Group - REAL NUMBERS FOR REAL BANKS Continuing Case Assignment for Chapter 5 FIRST LOOK AT YOUR BHC'S FINANCIAL STATEMENTS In Chapter 5, we focus most heavily on the financial statements for banking companies. As you read this chapter, you progress through a lengthy, yet interesting, discussion of the items found on the Report of Condition (balance sheet) and the Report of Income (income statement). In the chapter you find financial statements providing dollar amounts and then comparative financial statements where the ratios of items-to-assets are presented. The data was collected from Statistics for Deposi- tory Institutions at the FDIC's website (www2.fdic.gov/sdi/) and organized into tables using Excel. You will first create financial statements using dollar figures collected from SDI for your banking company for year-to-year comparisons, and you will then create financial statements for your banking company and its Peer Group using the ratios of items-to-assets. A. Add a spreadsheet entitled "Year-to-Year Comparisons" to your Excel workbook. Enter the data for your BHC in the format illustrated for BB&T. To fill in the dollar amounts for the Year-to-Year Compari- sons spreadsheet, go to www2.fdic.gov/sdi and enter SDI. You will create a report with two columns and you are pre- sented with two pull-down menus. From the first pull-down menu, select "Bank Holding Company," then enter your com- pany's BHC number, and select the report date for the most recent year-end. From the second pull-down menu, repeat the process, only you will select reports for December, one year prior. Follow the cues to generate a report selecting to "View" in "Dollars" for the first spreadsheet. For the Report of Condition you will be able to enter most data directly from the Assets and Liabilities report generated at the FDIC website; however, you will have to explore the Net Loans and Leases link to get Gross Loans and Leases and Unearned Income. For the Report of Income, you will find the information you need in the section called "Income and Expense." B. Create a second worksheet in the same workbook, but collect data in "Percent of Assets" rather than in dollars. This will be useful for comparative analysis, and you will collect data both for your BHC and a group of peer banks as illustrated for BB&T. To fill in the percentages of total assets, return to www2.fdic.gov/sdi and enter SDI. This time, you will create a report with four columns and you are presented with four pull-down menus. From the first pull-down menu, select "Bank Holding Company," then enter your company's BHC number and select the report date for the most recent year-end. From the second pull- down menu, choose "Standard Peer Group" and select "All Commercial Banks with Assets of More than $10 Billion" for the most recent year-end. You will repeat this process using the last two pull-down menus, only you will select reports for December, one year prior. Follow the cues to generate a report selecting to "View" in "Percent of Assets" and enter the same items as in Part A. By work- ing with these statements, you will be familiarizing your- self with real-world financial statements and developing the language to talk with finance professionals from all types of financial institutions. C. To develop an understanding of the relationships on the Reports of Condition and Income and to double-check for data collection errors, we will use our formula functions to calculate total assets, total liabilities and capital, total liabilities, before extraordinary items, and net income. Then use the for- total equity capital, net interest income, pretax net operating mula functions in Excel to create entries for the empty cells. For income, income before extraordinary items, and net income, example, the formula for total liabilities used in Column D would using the spreadsheet developed in Part A. First Step: copy be =SUM(B20:B25). If the formulas and entries are correct, you Columns B and C to Columns D and E. Second Step: clear the will get the same numerical values as in columns B and C, and values in the cells containing total assets (i.e., Cells 14 and you can be reassured that you are developing an understanding E4), total liabilities and capital, total liabilities, total equity capi- of the financial statements of banks and similar financial firms. tal, net interest income, pretax net operating income, income J23 D E F G H J L M B BB&T 12/31/2010 BE&T 12/31/2009 $153,404,719 $2,013,448 $22.984.031 S749.900 $104,797,664 $2,574,190 $0 $102,223,474 $825.696 $1.828.458 $1,586,739 $7.236.361 $13.956,612 $162,060,891 $2,078,739 $33,056,558 $534,813 $103,836,045 $2.430,358 50 $ 101,405,087 $727,261 $1565357 $1,623.418 57,403,013 $13,665 142 $153,404.710 $132,829,566 $ 107,579,061 $1,740,740 $575.943 $16,452 175 $1,530,502 S4951 245 $162.060,891 $142.147.539 $115,444,064 52,979,164 $438.504 $16.907,397 $1,533,252 $4845, 158 - A 1 2 Date 3 Report of Condition-Dollar Amounts in Thousands 4 Total assets 5 Cash and due from depository institutions 6 Securities 7 Federal funds sold & reverse repurchase agreements 8 Gross loans & leases 9 (less Loan loss allowance 10 (less) unearned income 11 Net Loans and leases 12 Trading account assets 13 Bank premises and fixed assets 14 Other real estate owned 15 Goodwill and other intangibles 16 All other assets 17 18 Total liabilities and capital 19 Total liabilities 20 Total deposits 21 Federal funds purchased & repurchase agreements) 22 Trading liabilities 23 Other borrowed funds 24 Subordinatod dobt 25 All other liabilities 26 27 Total equity capital 28 Perpetual preferred stock 29 Common stock 30 Surplus 31 Undivided profits 32 Noncontrolling interests in consolidated subs 33 Report of Income 34 Total interest income 35 Total interest expense 36 Net interest income 37 Provision for loan and lease losses 38 Total noninterest income 39 Fiduciary activities 40 Service charges on deposit accounts 41 Trading account gains & fees 42 Additional noninterest income 43 Total noninterest expense 44 Salaries and employee benefits 45 Premises and equipment expense 45 Additional noninterest expense 47 Pre-tax net operating income 48 Securities gains losses) 49 Applicable income taxes 50 Income before extraordinary items 51 Extraordinary paina dosegnet 52 Net income attributable to bank and no interests) 53 N Basic Information Year-to-Year Comparisons - Ready $20,575,0531 $0 $26.437 $13,671 939 $3017011 $2.958.866 $19,913,352 SO $26,437 $13.156.141 $37AA AR 52.941,893 $6,637 0461 $1.392.458 $5,244,500 $2,546 391 $2,426.267 $109.476 S619 493 $22,388 $1,674 910 S4 704 639 $2,338,013 55B6,579 $1.7B0 047 $419.825 5553,757 $64.836 $ $908,746 $0 S908 746 $6 460 773 $1,785,324 54,675,449 $2615, 190 53.031.334 $106.173 $691 028 $52,292 $2.181.643 $4 345,087 $2 214,063 5555,119 $1,575,000 $746,505 $224334 $128.662 $842 178 50 $842178 Comparisons wth Peer Group 1009 Clipboard Font Allarment Number Styles Cells Editing A1 F G H TJ K L M N A B C D E 17 BB&Peer GroupBB&T T &T Peer Group 2 Date 12/31/2010 12/31/2010 12/31/2009 12/31/2009 3 Report of Condition-Percentage of Average Assets 4 Total assets 100.00% 100.00% 100.00% 100.00% 5 Cash and due from depository institutions 1.31% 7.59% 1.28% 8.01% 6 Securities 14.09% 10.25% 20.40% 19 53% 7 Federal funds sold & reverse repurchase agreements 0.49% 435% 0.33% 3.86% 8 Gross loans & leases 68.31% 52.39% 04.07% 5200% 9 (less) Loan loss allowance 1.68% 1.8096 1.50% 1.90% 10 less, unearned income 0.00% 001% 0.00% 0 02% 11 Not Loans and leases 66.6498 50.48% 32.57% 50.07% 12 Trading account assets 0.54% 7.35% 0.45% 7.46% 13 Bank premises and fixed assets 1.19% 0.74% 0.97% 074% 14 Other real estate owned 1.03% 0.25% 1.00% 0.18% 15 Coodwill and other intangibles 4.72% 3.57% 4.57% 3.70% 16 All cher assets 9.10% 5.42% 843% 6.78% 17 18 Total liabilities and capital 100.00% 100.00% 100.00% % 100.00% 19 Total abilities 86.59% 88.55% % 87.71% 88.76% 20 Total deposits 70.13% 68.22% 71.23% 08 209 21 Federal funds purchased & repurchase agreements) 1.13% 4.70% 1.849 5029 22 Trading liabilmes 0.38% 294% 0.27% 267% 23 Other borrowed funds 10.72% 8.32% 10.43% 8 43% 24 Subordinatod dobt 1.00% 1.46% 0.95% 1.61 25 All other liabilities 3.23% 2.91% 2.99% 2 83% 26 27 Total oquity capital 13.41% 11.45% 12.29% 11.24% 28 Perpetual preferred stock 0.00% 0.04% 0.00% 004% 29 Common stock 0.02% 0.25% 0.02% 0.25% 30 Surplus 8.91% 9.00% 8.12% 902% 31 Uncinded profits 95% 19% 2340% 1729 32 Noncontrolling interests in consolidated subs 1.93% 0.27% 1.82% 0 21% 33 Report of Incomo 34 Total interest income 4.25% 3.88% % 4.23% 378% 35 Total interest expense 0.89% 0.65% 1.17% 0 88% 36 Net interest income 3.36% 3.23% 3.0696 291% 37 Provision for loan and lease lastes 1.63% 12596 202% 30 Total non interest income 1.55% 1.98% 1.98% 220% 39 Fiduciary activities 0.07% 0 23% 0.07% 022% 40 Service charges on deposit accounts 0.40% 0.29% 0.45% 0 34% 41 Trading account gains & fees 0.01% 023% 0.03% 0 24% 42 Additional noninterest incomo 1.079 1.23% 1.4396 1.40% 43 Total noninterest expense 3.01% % 2.96% 2.84% 3.06% 44 Salaries and employee beneits 1.50% 1.27% 1.45% 121% 45 Premises and equipment expense 0.38% 0.33% 0.36% 0.33% 45 Additional noninterest expense 1 14% 1.3696 1.03% 1 52% 47 Pre-tax net operating Income 0.27% 0.99% 0.49% 003% 48 Securities gains 105305) 0.35% 0.07% 0.15% -0.01% 49 Applicable income taxes 0.04% 0.30% 0.08% 004% 50 Income before extraordinary Items 0.58% 0.77% 0.55% -0.02% 51 Extraordinary gainalooco) not 0.0096 0.0196 0.0096 0.04% 52 Net income attributable to bank and ne interests) 0.58% 0.76% 0.55% -0.06% 53 Basic Information Year-to-Year Comparsons Comparisons with Peer Group
Step by Step Solution
There are 3 Steps involved in it

Get step-by-step solutions from verified subject matter experts