

Question: Real World Financials The table below contains selected information from recent financial statements of Green and White, two companies in the home improvement retail industry
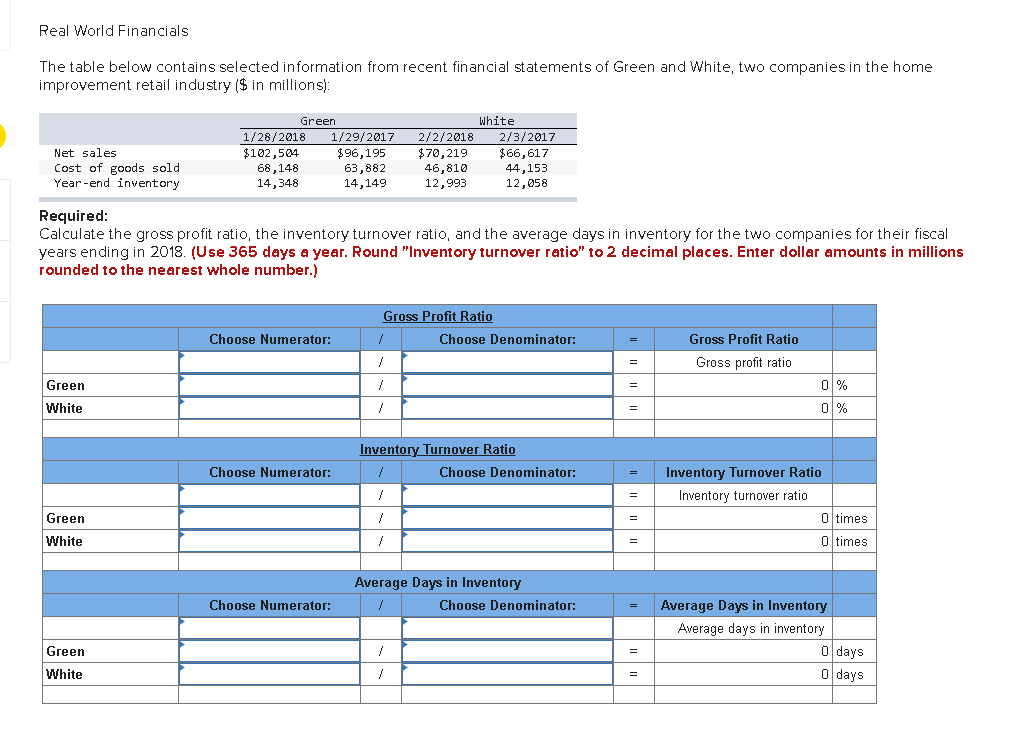
Real World Financials The table below contains selected information from recent financial statements of Green and White, two companies in the home improvement retail industry ($ in millions): Net sales Cost of goods sold Year-end inventory Green 1/28/2018 1/29/2017 $102,504 $96,195 68,148 63,882 14,348 14,149 White 2/2/2018 2/3/2017 $70,219 $66,617 46,810 44,153 12,993 12,658 Required: Calculate the gross profit ratio, the inventory turnover ratio, and the average days in inventory for the two companies for their fiscal years ending in 2018. (Use 365 days a year. Round "Inventory turnover ratio" to 2 decimal places. Enter dollar amounts in millions rounded to the nearest whole number.) Choose Numerator: Gross Profit Ratio / Choose Denominator: / Gross Profit Ratio Gross profit ratio = Green White / / 0 % 0 % Choose Numerator: Inventory Turnover Ratio / Choose Denominator: / = Inventory Turnover Ratio Inventory turnover ratio O times Green White / / 0 times Average Days in Inventory Choose Denominator: Choose Numerator: Average Days in Inventory Average days in inventory 0 days 0 days / Green White /
Step by Step Solution
There are 3 Steps involved in it

Get step-by-step solutions from verified subject matter experts