

Real-estate agents are often interested in the factors that predict the selling prices of houses. To study
Question:
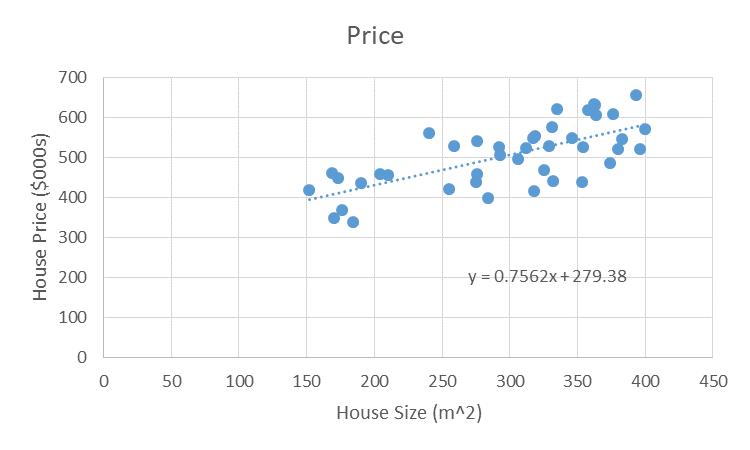
Real-estate agents are often interested in the factors that predict the selling prices of houses. To study the relationship between the size of a house and the selling price, an agent collected data on 42 houses and obtained the following variables:
Y = Selling price of the house (in hundreds of thousands)
X = The size of the house (in square meters).
A simple regression model of the form:
Price = b0 + b1Size + e
was estimated and an excerpt from the output is shown below.
Regression Statistics | ||||
Multiple R | 0.6942319 | |||
R Square | 0.4819579 | |||
Adjusted R Square | 0.4690069 | |||
Standard Error | 58.263857 | |||
Observations | 42 | |||
ANOVA | ||||
df | SS | MS | F | |
Regression | 1 | 126328.8571 | 126328.9 | 37.21381 |
Residual | 40 | 135787.0791 | 3394.677 | |
Total | 41 | 262115.9362 | ||
Coefficients | Standard Error | t Stat | P-value | |
Intercept | 279.38 | 37.983 | 7.3553 | 0.0000 |
Size | 0.7562 | 0.1240 | 6.1003 | 0.0000 |
Answer the following questions, using the above information.
i. Determine the dependent and independent variable of the model.
Dependent variable:
Independent variable:
ii. Based on the estimation results in the output, write down the estimated regression model in the form: Price^ = + Size
Price^ =
iii. Interpret the estimated intercept term ( ):
Interpret the estimated slope coefficient ( ).
iv. Using the p-value from the output, test at the 5% significance level that house size (X) has a significantly positive effect on the price.
Ho:
HA:
Test statistic and its sampling distribution:
Level of significance a =
Decision rule (p-value method):
p-value:
Conclusion:
v. Value of the coefficient of determination R2 =
Interpret the value of R2 and comment on the fitness of the model.
vi. What is the standard error of estimate (se)? Using the standard error of estimate, assess the fitness of the model.
vii. Forecast the selling price of a house that is 240 square meters
viii. Suppose the correlation coefficient is 0.694. Comment on the strength and direction of the linear relationship between the two variables.
ix. Test the hypothesis that the population coefficient of correlation (r) is significantly different from zero (r ¹ 0).
Ho:
HA:
Test statistic and its distribution:
Level of significance a =
Decision rule:
Calculate the value of the test statistic or p-value:
Conclusion:
Expert Answer:


Statistics The Exploration & Analysis of Data
ISBN: 978-1133164135
7th edition
Authors: Roxy Peck, Jay L. Devore
