

Question: Really need some guidance with this one... I cannot locate the BS or Income Statements and I'm not sure what to do when I find
 Really need some guidance with this one... I cannot locate the BS or Income Statements and I'm not sure what to do when I find them.
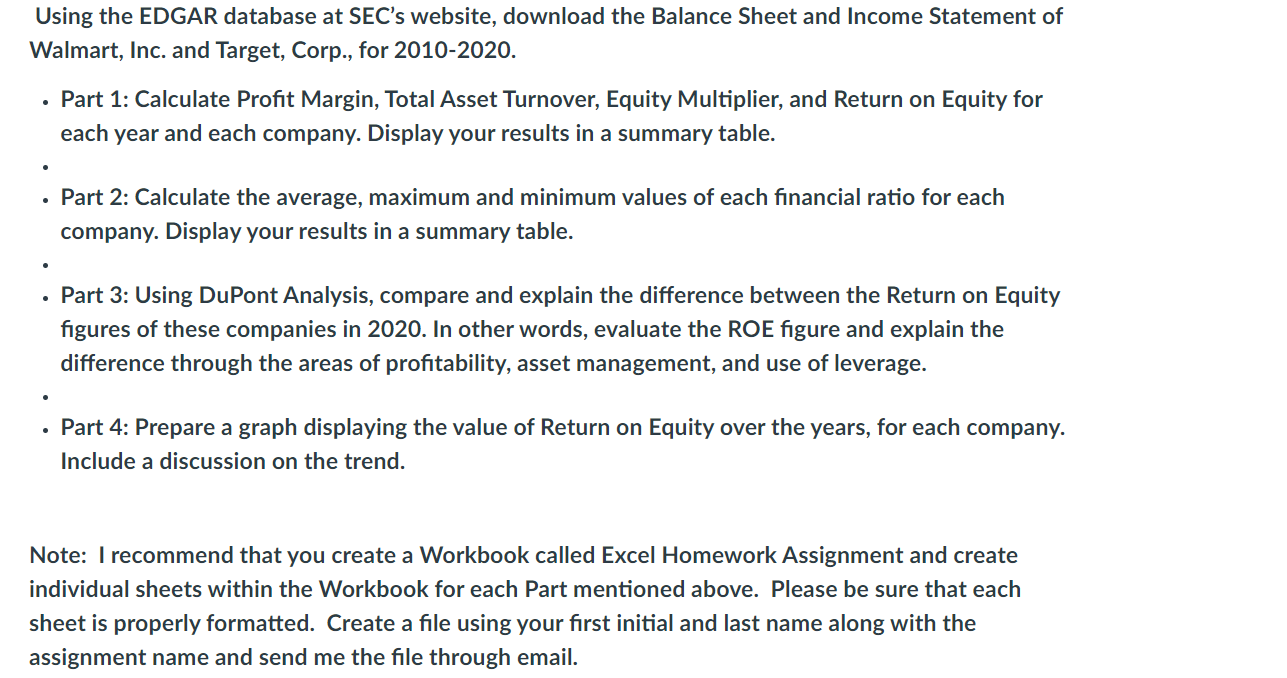
Using the EDGAR database at SEC's website, download the Balance Sheet and Income Statement of Walmart, Inc. and Target, Corp., for 2010-2020. Part 1: Calculate Profit Margin, Total Asset Turnover, Equity Multiplier, and Return on Equity for each year and each company. Display your results in a summary table. Part 2: Calculate the average, maximum and minimum values of each financial ratio for each company. Display your results in a summary table. Part 3: Using DuPont Analysis, compare and explain the difference between the Return on Equity figures of these companies in 2020. In other words, evaluate the ROE figure and explain the difference through the areas of profitability, asset management, and use of leverage. Part 4: Prepare a graph displaying the value of Return on Equity over the years, for each company. Include a discussion on the trend. Note: I recommend that you create a Workbook called Excel Homework Assignment and create individual sheets within the Workbook for each Part mentioned above. Please be sure that each sheet is properly formatted. Create a file using your first initial and last name along with the assignment name and send me the file through email. Using the EDGAR database at SEC's website, download the Balance Sheet and Income Statement of Walmart, Inc. and Target, Corp., for 2010-2020. Part 1: Calculate Profit Margin, Total Asset Turnover, Equity Multiplier, and Return on Equity for each year and each company. Display your results in a summary table. Part 2: Calculate the average, maximum and minimum values of each financial ratio for each company. Display your results in a summary table. Part 3: Using DuPont Analysis, compare and explain the difference between the Return on Equity figures of these companies in 2020. In other words, evaluate the ROE figure and explain the difference through the areas of profitability, asset management, and use of leverage. Part 4: Prepare a graph displaying the value of Return on Equity over the years, for each company. Include a discussion on the trend. Note: I recommend that you create a Workbook called Excel Homework Assignment and create individual sheets within the Workbook for each Part mentioned above. Please be sure that each sheet is properly formatted. Create a file using your first initial and last name along with the assignment name and send me the file through email
Step by Step Solution
There are 3 Steps involved in it

Get step-by-step solutions from verified subject matter experts