

Question: REALLY REALLY NEED HELP! PLEASE HELP ME DEPEDENT VARIABLE: Current health expenditure per capita (Current US$) (PCHE) INDEPEDENT VARIABLE: Birth rate, crude (per 1000 people)
REALLY REALLY NEED HELP! PLEASE HELP ME
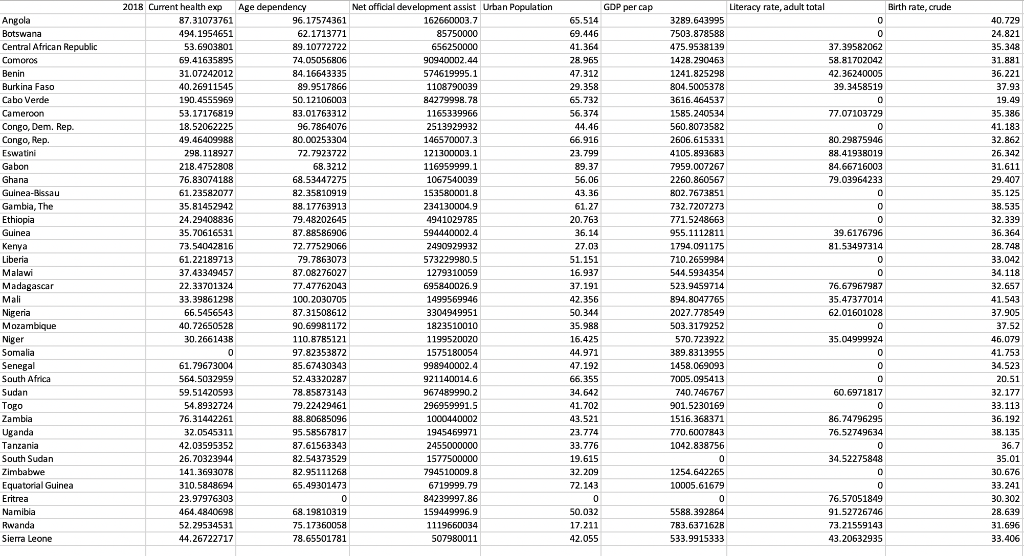
DEPEDENT VARIABLE: Current health expenditure per capita (Current US$) (PCHE)
INDEPEDENT VARIABLE:
Birth rate, crude (per 1000 people) (CBR) Li
teracy rate, adult total (% of people ages 15 and above) (Literate)
Urbanization (urban population, % of the total population) (Urban)
Share of dependency ratio (%) (DepRatio)
GDP per capita (current US$) (GDPPC)
Net official development assistance received (current US$) (netODA)
3. Generate an interaction term between variable Per Capita GDP and variable High DepRatio (HDR). Reestimate Model 2 adding this interaction term in this model (Model 3). Write your sample multiple linear regression of Model 3.
4. State the hypothesis and discuss the results of the t-test of the interaction term ONLY in Model 3? Interpret the coefficient of the interaction variable if it is statistically significant.
5. Your colleague suggests re-working on the model by taking a different functional form of some of your collected variable/s from part 1 to measure Current health expenditure per capita (Current US$) (PCHE) (Model 4). Explain what the reason/s are/is of using different functional forms. Write your sample multiple linear regression of Model 4 and test whether you get a better model to measure PCHE as compared to any previous models (1, 2 or 3).
6. Suggest the final preferred model (from 1 to 4) you will use to estimate PCHE. Further, comment on the assumptions of the final model and interpret all the significant coefficients in the final model.
Birth rate, crude Angola Botswana Central African Republic Comoros Benin Burkina Faso Cabo Verde Cameroon Congo, Dem. Rep. Congo, Rep. Eswatini Gabon Ghana Guinea-Bissau Gambia, The Ethiopia Guinea Kenya Liberia Malawi Madagascar Mali Nigeria Mozambique Niger Somalia Senegal South Africa Sudan Togo Zambia Uganda Tanzania South Sudan Zimbabwe Equatorial Guinea Eritrea Namibia Rwanda Sierra Leone 2018 Current health exp Age dependency 87.31073761 96.17574361 494.1954651 62.1713771 53.6903801 89.10772722 69.41635895 74.05056806 31.07242012 84.16643335 40.26911545 89.9517866 190.4555969 50.12106003 53.17176819 83.01763312 18.52062225 96.7864076 49.46409988 80.00253304 298.118927 72.7923722 218.4752808 68.3212 76.83074188 68.53447275 61.23582077 82.35810919 35.81452942 88.17763913 24.29408836 79.48202645 35.70616531 87.88586906 73.54042816 72.77529066 61.22189713 79.7863073 37.43349457 87.08276027 22.33701324 77.47762043 33.39861298 100.2030705 66.5456543 87.31508612 40.72650528 90.69981172 30.2661438 110.8785121 0 97.82353872 61.79673004 85.67430343 564.5032959 52.43320287 59.51420593 78.85873143 54.8932724 79.22429461 76.31442261 88.80685096 32.0545311 95.58567817 42.03595352 87.61563343 26.70323944 82.54373529 141.3693078 82.95111268 310.5848694 65.49301473 23.97976303 0 0 464.4840698 68.19810319 52.29534531 75.17360058 44.26722717 78.65501781 Net official development assist Urban Population 162660003.7 85750000 656250000 90940002.44 574619995.1 1108790039 84279998.78 1165339966 2513929932 146570007.3 121300003.1 116959999.1 1067540039 153580001.8 234130004.9 4941029785 594440002.4 2490929932 573229980.5 1279310059 695840026.9 1499569946 3304949951 1823510010 1199520020 1575180054 998940002.4 921140014.6 967489990.2 296959991.5 1000440002 1945469971 2455000000 1577500000 794510009.8 6719999.79 84239997.86 159449996.9 1119660034 507980011 GDP per cap 65.514 69.446 41.364 28.965 47.312 29.358 65.732 56.374 44.46 66.916 23.799 89.37 56.06 43.36 61.27 20.763 36.14 27.03 51.151 16.937 37.191 42.356 50.344 35.988 16.425 44.971 47.192 66.355 34.642 41.702 43.521 23.774 33.776 19.615 32.209 72.143 0 50.032 17.211 42.055 3289.643995 7503.878588 475.9538139 1428.290463 1241.825298 804.5005378 3616.464537 1585.240534 560.8073582 2606.615331 4105.893683 7959.007267 2260.860567 802.7673851 732.7207273 771.5248663 955.1112811 1794.091175 710.2659984 544.5934354 523.9459714 894.8047765 2027.778549 503.3179252 570.723922 389.8313955 1458.069093 7005.095413 740.746767 901.5230169 1516.368371 770.6007843 1042.838756 0 1254.642265 10005.61679 0 5588.392864 783.6371628 533.9915333 Literacy rate, adult total 0 0 37.39582062 58.81702042 42.36240005 39.3458519 0 77.07103729 0 80.29875946 88.41938019 84.66716003 79.03964233 0 0 0 0 0 39.6176796 81.53497314 0 0 0 76.67967987 35.47377014 62.01601028 0 35.04999924 0 0 0 0 0 60.6971817 0 0 86.74796295 76.52749634 0 34.52275848 0 0 76.57051849 91.52726746 73.21559143 43.20632935 40.729 24.821 35.348 31.881 36.221 37.93 19.49 35.386 41.183 32.862 26.342 31.611 29.407 35.125 38.535 32.339 36.364 28.748 33.042 34.118 32.657 41.543 37.905 37.52 46.079 41.753 34.523 20.51 32.177 33.113 36.192 38.135 36.7 35.01 30.676 33.241 30.302 28.639 31.696 33.406 Birth rate, crude Angola Botswana Central African Republic Comoros Benin Burkina Faso Cabo Verde Cameroon Congo, Dem. Rep. Congo, Rep. Eswatini Gabon Ghana Guinea-Bissau Gambia, The Ethiopia Guinea Kenya Liberia Malawi Madagascar Mali Nigeria Mozambique Niger Somalia Senegal South Africa Sudan Togo Zambia Uganda Tanzania South Sudan Zimbabwe Equatorial Guinea Eritrea Namibia Rwanda Sierra Leone 2018 Current health exp Age dependency 87.31073761 96.17574361 494.1954651 62.1713771 53.6903801 89.10772722 69.41635895 74.05056806 31.07242012 84.16643335 40.26911545 89.9517866 190.4555969 50.12106003 53.17176819 83.01763312 18.52062225 96.7864076 49.46409988 80.00253304 298.118927 72.7923722 218.4752808 68.3212 76.83074188 68.53447275 61.23582077 82.35810919 35.81452942 88.17763913 24.29408836 79.48202645 35.70616531 87.88586906 73.54042816 72.77529066 61.22189713 79.7863073 37.43349457 87.08276027 22.33701324 77.47762043 33.39861298 100.2030705 66.5456543 87.31508612 40.72650528 90.69981172 30.2661438 110.8785121 0 97.82353872 61.79673004 85.67430343 564.5032959 52.43320287 59.51420593 78.85873143 54.8932724 79.22429461 76.31442261 88.80685096 32.0545311 95.58567817 42.03595352 87.61563343 26.70323944 82.54373529 141.3693078 82.95111268 310.5848694 65.49301473 23.97976303 0 0 464.4840698 68.19810319 52.29534531 75.17360058 44.26722717 78.65501781 Net official development assist Urban Population 162660003.7 85750000 656250000 90940002.44 574619995.1 1108790039 84279998.78 1165339966 2513929932 146570007.3 121300003.1 116959999.1 1067540039 153580001.8 234130004.9 4941029785 594440002.4 2490929932 573229980.5 1279310059 695840026.9 1499569946 3304949951 1823510010 1199520020 1575180054 998940002.4 921140014.6 967489990.2 296959991.5 1000440002 1945469971 2455000000 1577500000 794510009.8 6719999.79 84239997.86 159449996.9 1119660034 507980011 GDP per cap 65.514 69.446 41.364 28.965 47.312 29.358 65.732 56.374 44.46 66.916 23.799 89.37 56.06 43.36 61.27 20.763 36.14 27.03 51.151 16.937 37.191 42.356 50.344 35.988 16.425 44.971 47.192 66.355 34.642 41.702 43.521 23.774 33.776 19.615 32.209 72.143 0 50.032 17.211 42.055 3289.643995 7503.878588 475.9538139 1428.290463 1241.825298 804.5005378 3616.464537 1585.240534 560.8073582 2606.615331 4105.893683 7959.007267 2260.860567 802.7673851 732.7207273 771.5248663 955.1112811 1794.091175 710.2659984 544.5934354 523.9459714 894.8047765 2027.778549 503.3179252 570.723922 389.8313955 1458.069093 7005.095413 740.746767 901.5230169 1516.368371 770.6007843 1042.838756 0 1254.642265 10005.61679 0 5588.392864 783.6371628 533.9915333 Literacy rate, adult total 0 0 37.39582062 58.81702042 42.36240005 39.3458519 0 77.07103729 0 80.29875946 88.41938019 84.66716003 79.03964233 0 0 0 0 0 39.6176796 81.53497314 0 0 0 76.67967987 35.47377014 62.01601028 0 35.04999924 0 0 0 0 0 60.6971817 0 0 86.74796295 76.52749634 0 34.52275848 0 0 76.57051849 91.52726746 73.21559143 43.20632935 40.729 24.821 35.348 31.881 36.221 37.93 19.49 35.386 41.183 32.862 26.342 31.611 29.407 35.125 38.535 32.339 36.364 28.748 33.042 34.118 32.657 41.543 37.905 37.52 46.079 41.753 34.523 20.51 32.177 33.113 36.192 38.135 36.7 35.01 30.676 33.241 30.302 28.639 31.696 33.406
Step by Step Solution
There are 3 Steps involved in it

Get step-by-step solutions from verified subject matter experts