

Question: Real-Time Data Analysis Exercise The following table gives the value of selected consumer price index categories from FRED* for July, 2018 andJuly, 2023. Consumer Price
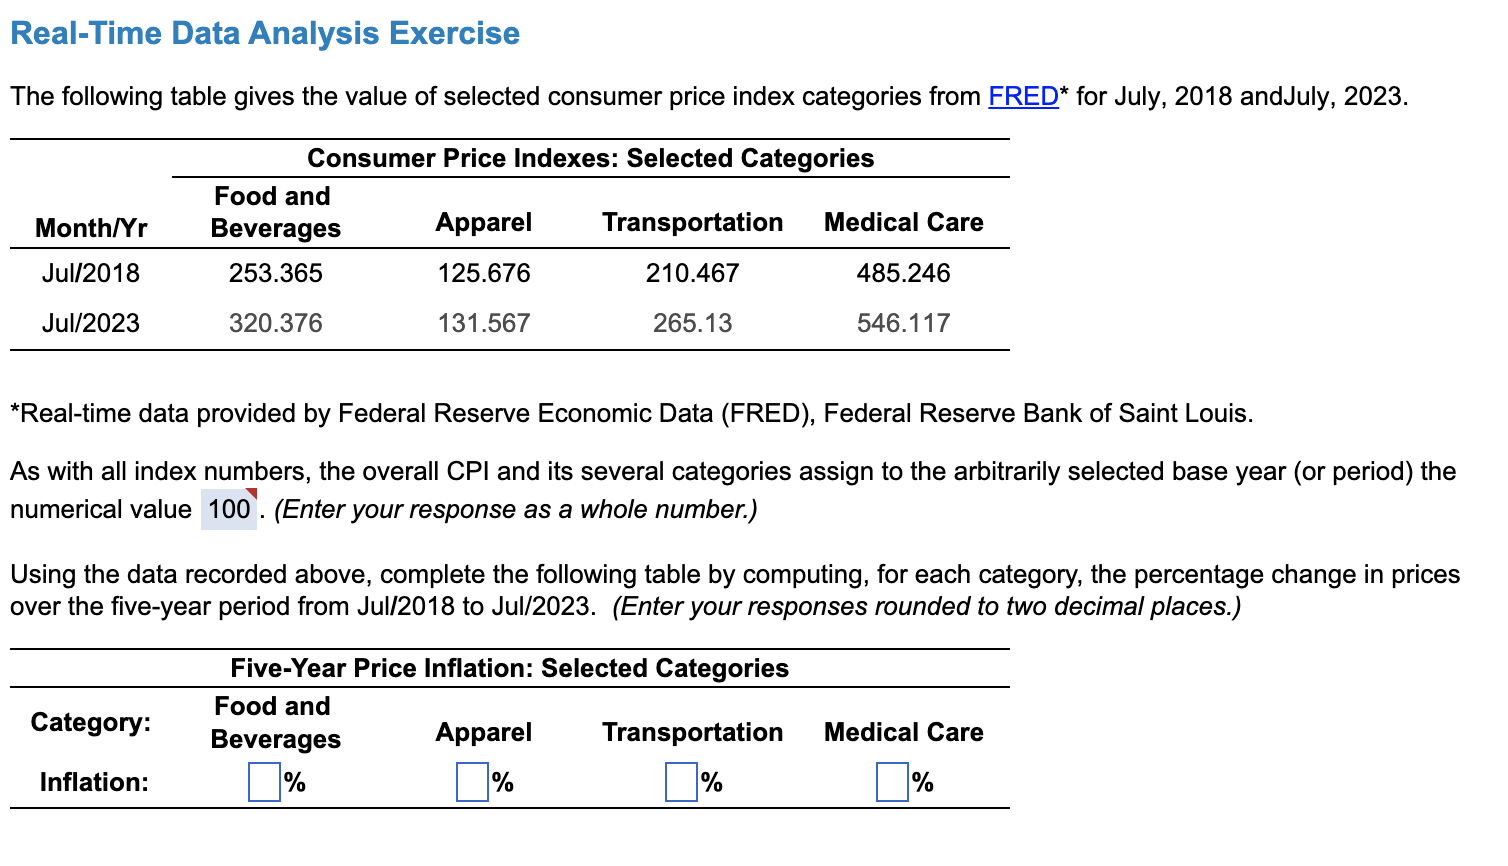

Real-Time Data Analysis Exercise The following table gives the value of selected consumer price index categories from FRED* for July, 2018 andJuly, 2023. Consumer Price Indexes: Selected Categories Food and Montthr Beverages Apparel Transportation Medical Care Jull2018 253.365 125.676 210.467 485.246 Jul/2023 320.376 131.56? 265.13 546.117 *Realtime data provided by Federal Reserve Economic Data (FRED), Federal Reserve Bank of Saint Louis. As with all index numbers, the overall CPI and its several categories assign to the arbitrarily selected base year (or period) the numerical value 100'. (Enter your response as a whole number.) Using the data recorded above, complete the following table by computing, for each category, the percentage change in prices over the veyear period from Ju|l2018 to Jul/2023. (Enter your responses rounded to two decimal places.) Five-Year Price Ination: Selected Categories Food and Beverages Apparel Transportation Medical Care Inflation: |:|% |:|% D'Ma El% Category
Step by Step Solution
There are 3 Steps involved in it

Get step-by-step solutions from verified subject matter experts