

Question: Recall recent lecture content on how to use MATLAB app designer to construct a graphical user interface ( GUI ) program. Make a MATLAB GUI
Recall recent lecture content on how to use MATLAB app designer to construct a graphical user interface
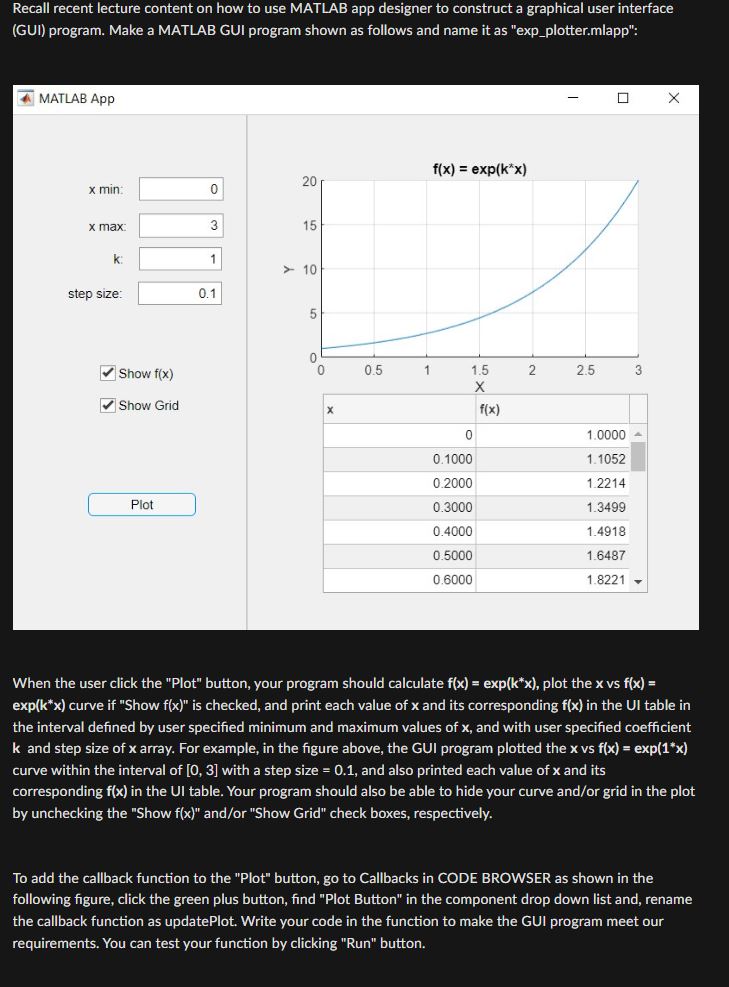
GUI program. Make a MATLAB GUI program shown as follows and name it as "expplotter.mlapp":
MATLAB App
xmin :
max:
k:
step size:
Show
Show Grid
When the user click the "Plot" button, your program should calculate exp plot the vs
exp curve if "Show is checked, and print each value of and its corresponding in the UI table in
the interval defined by user specified minimum and maximum values of and with user specified coefficient
and step size of array. For example, in the figure above, the GUI program plotted the vs exp
curve within the interval of with a step size and also printed each value of and its
corresponding in the UI table. Your program should also be able to hide your curve andor grid in the plot
by unchecking the "Show andor "Show Grid" check boxes, respectively.
To add the callback function to the "Plot" button, go to Callbacks in CODE BROWSER as shown in the
following figure, click the green plus button, find "Plot Button" in the component drop down list and, rename
the callback function as updatePlot. Write your code in the function to make the GUI program meet our
requirements. You can test your function by clicking "Run" button.
Step by Step Solution
There are 3 Steps involved in it
1 Expert Approved Answer
Step: 1 Unlock

Question Has Been Solved by an Expert!
Get step-by-step solutions from verified subject matter experts
Step: 2 Unlock
Step: 3 Unlock