

Question: Recently we investigated a scatterplot on Gapminder org The table below shows the Income per capita in thousands of dollars per year and Life Expectancy

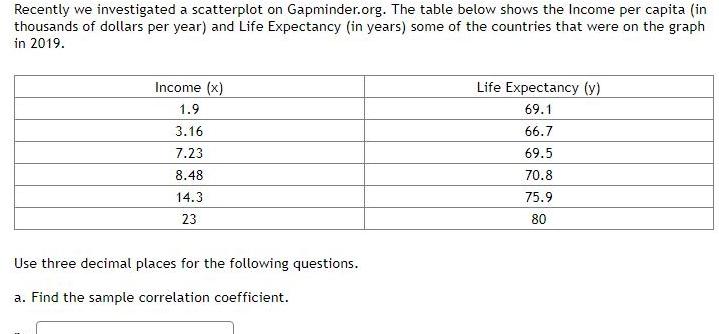
Recently we investigated a scatterplot on Gapminder org The table below shows the Income per capita in thousands of dollars per year and Life Expectancy in years some of the countries that were on the graph in 2019 Income x 1 9 3 16 7 23 8 48 14 3 23 Use three decimal places for the following questions a Find the sample correlation coefficient Life Expectancy y 69 1 66 7 69 5 70 8 75 9 80
Step by Step Solution
There are 3 Steps involved in it
1 Expert Approved Answer
Step: 1 Unlock

Question Has Been Solved by an Expert!
Get step-by-step solutions from verified subject matter experts
Step: 2 Unlock
Step: 3 Unlock