

Question: re.com/co D Question 24 5 pts The is the probability of getting a test statistic at least as extreme as the one representing the sample

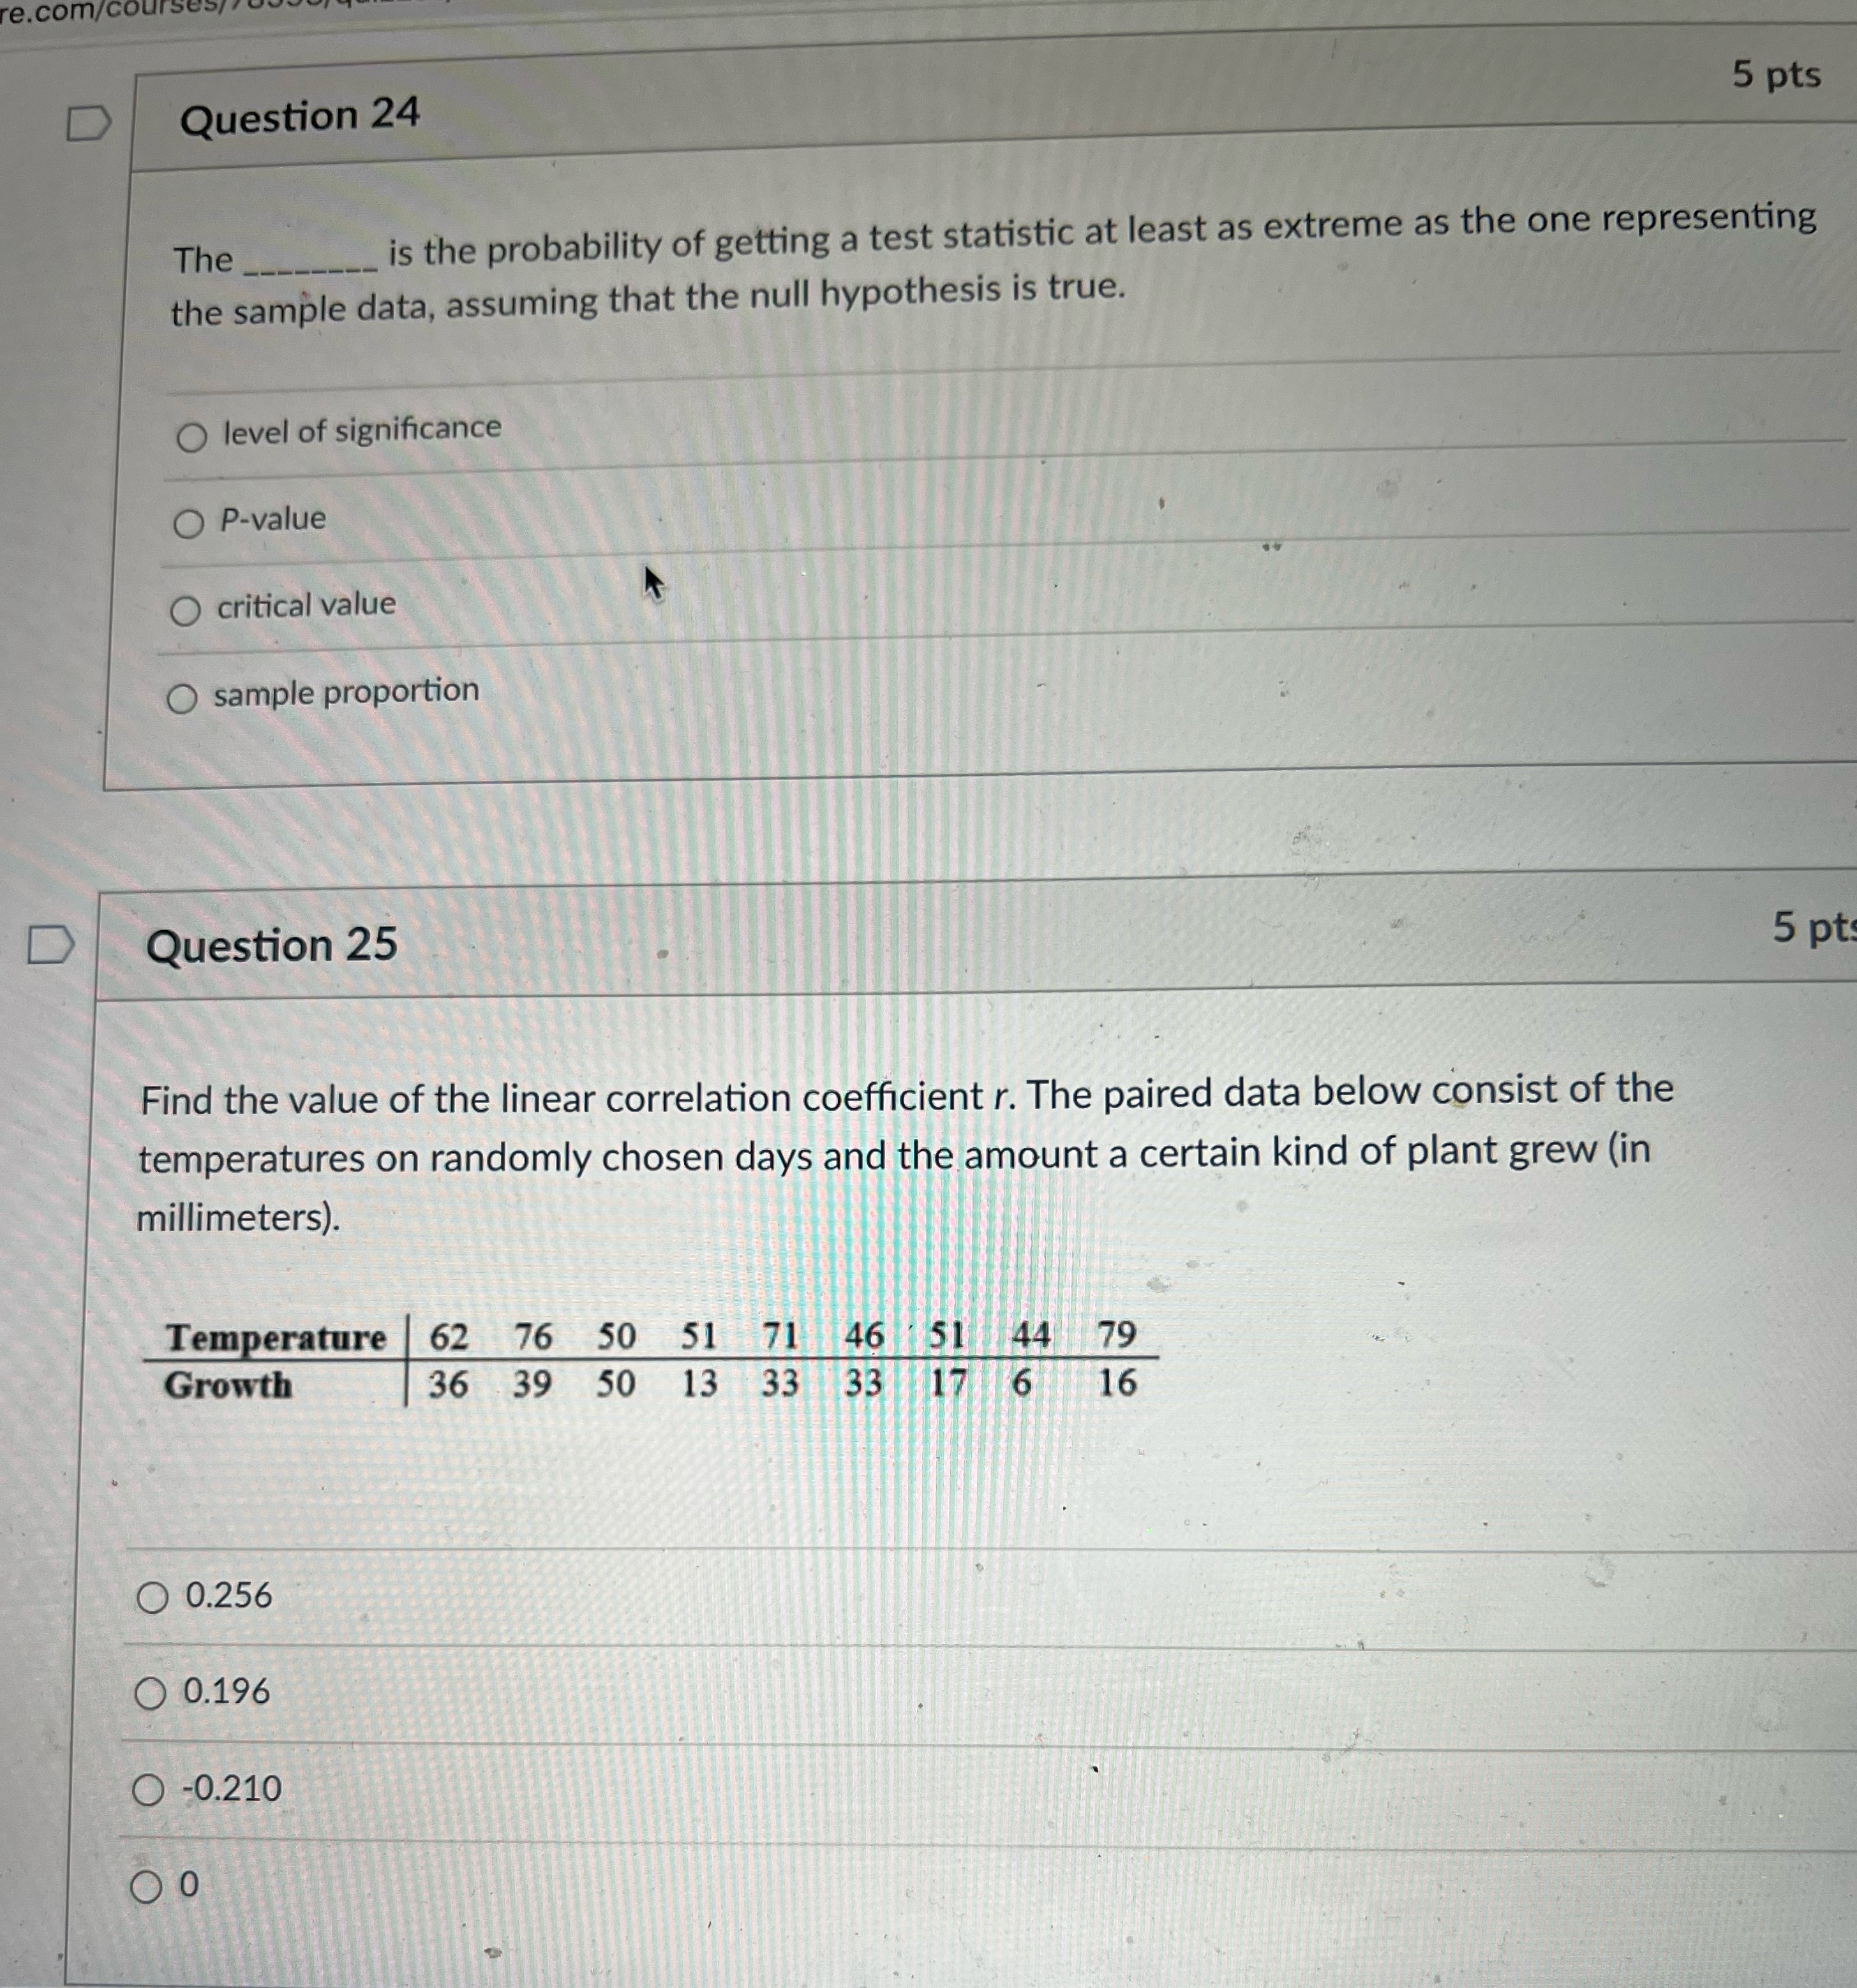
re.com/co D Question 24 5 pts The is the probability of getting a test statistic at least as extreme as the one representing the sample data, assuming that the null hypothesis is true. O level of significance O P-value critical value sample proportion D Question 25 5 pt Find the value of the linear correlation coefficient r. The paired data below consist of the temperatures on randomly chosen days and the amount a certain kind of plant grew (in millimeters). Temperature 62 76 50 51 71 46 51 44 79 Growth 36 39 50 13 33 3 17 6 16 O 0.256 O 0.196 O -0.210 Oo
Step by Step Solution
There are 3 Steps involved in it
1 Expert Approved Answer
Step: 1 Unlock

Question Has Been Solved by an Expert!
Get step-by-step solutions from verified subject matter experts
Step: 2 Unlock
Step: 3 Unlock