

Question: Record your responses in a spreadsheet. Part A: Horizontal Analysis Item Net Sales Cost of Goods Sold Gross Profit 2015 $880 000 $ $280
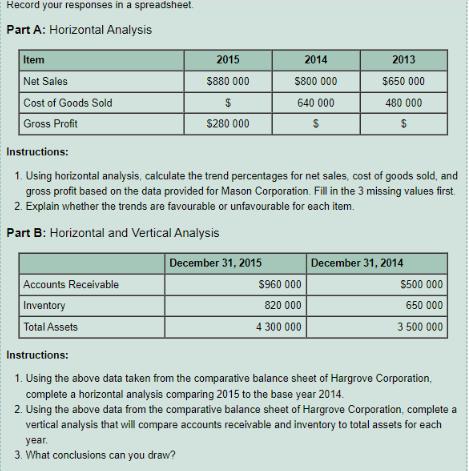
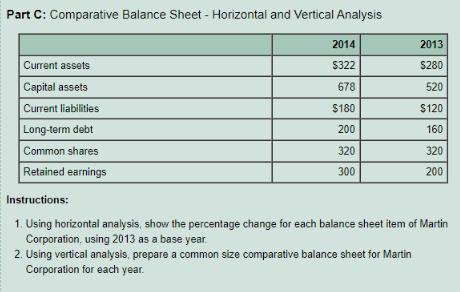
Record your responses in a spreadsheet. Part A: Horizontal Analysis Item Net Sales Cost of Goods Sold Gross Profit 2015 $880 000 $ $280 000 Accounts Receivable Inventory Total Assets 2014 $800 000 640 000 S December 31, 2015 Instructions: 1. Using horizontal analysis, calculate the trend percentages for net sales, cost of goods sold, and gross profit based on the data provided for Mason Corporation. Fill in the 3 missing values first 2. Explain whether the trends are favourable or unfavourable for each item. Part B: Horizontal and Vertical Analysis 2013 $960 000 820 000 4 300 000 $650 000 480 000 $ December 31, 2014 $500 000 650 000 3 500 000 Instructions: 1. Using the above data taken from the comparative balance sheet of Hargrove Corporation, complete a horizontal analysis comparing 2015 to the base year 2014. 2. Using the above data from the comparative balance sheet of Hargrove Corporation, complete a vertical analysis that will compare accounts receivable and inventory to total assets for each year. 3. What conclusions can you draw? Part C: Comparative Balance Sheet - Horizontal and Vertical Analysis Current assets Capital assets Current liabilities Long-term debt Common shares Retained earnings 2014 $322 678 $180 200 320 300 2013 $280 520 $120 160 320 200 Instructions: 1. Using horizontal analysis, show the percentage change for each balance sheet item of Martin Corporation, using 2013 as a base year 2. Using vertical analysis, prepare a common size comparative balance sheet for Martin Corporation for each year.
Step by Step Solution
3.33 Rating (144 Votes )
There are 3 Steps involved in it
Part A Horizontal Analysis This involves calculating the trend percentages for net sales cost of goods sold and gross profit on the data provided for Pearson Corporation To compute the horizontal anal... View full answer

Get step-by-step solutions from verified subject matter experts