

Question: Recreate the table given below in Excel. Add columns to the table below to compiete neeueu information. 1- It is important to establish a relationship
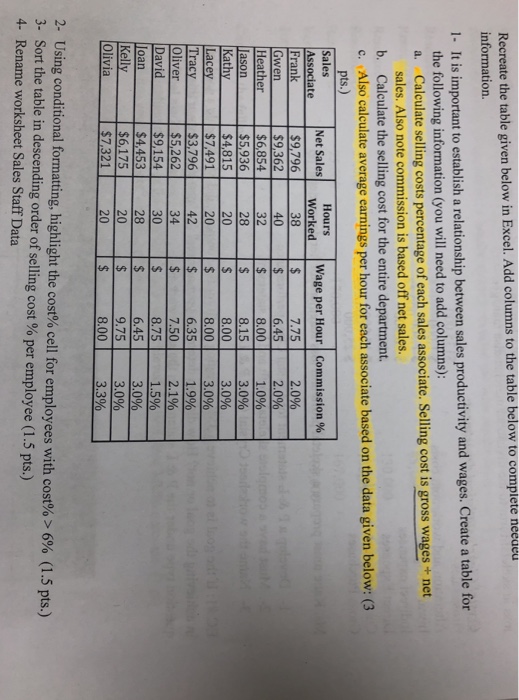
Recreate the table given below in Excel. Add columns to the table below to compiete neeueu information. 1- It is important to establish a relationship between sales productivity and wages. Create a table for the following information (you will need to add columns): a. Calculate selling costs percentage of each sales associate. Selling cost is gross wages+ net sales. Also note commission is based off net sales. b. Calculate the selling cost for the entire department. c. Also calculate average earnings per hour for each associate based on the data given below: (3 Net Sales Worked Wage per Hour | Commission % Associate 7.75 | 2.096 6.45 2.0 1.0% 3.0% 3.0% 3.0% 1.9 % 2.1% 1.5% 3.0% 3.0% 3.3% 40 32 Gwen Heather ason $5,936 Kathy $4,815 Lacey $7491 Tracy $3,796 Oliver David 8.15 $5,262 $9,154 $4453 $6,175 $7.321 20 20 42 34 30 8.00 6.35 7.50 8.75 6.45 9.75 8.00 oan 20 20 Olivia 2-Using conditional formatting, highlight the cost% cell for em ployees with cost%-6% (1.5 pts.) 3- Sort the table in descending order of selling cost % per employee (1.5 pts.) 4- Rename worksheet Sales Staff Data
Step by Step Solution
There are 3 Steps involved in it

Get step-by-step solutions from verified subject matter experts