

Question: recreate this code so that it prints this graph on Jupyter notebook please! DATA TO GRAPH Days since launch Last year begin{tabular}{rr} & Progress to
 recreate this code so that it prints this graph on Jupyter notebook please!
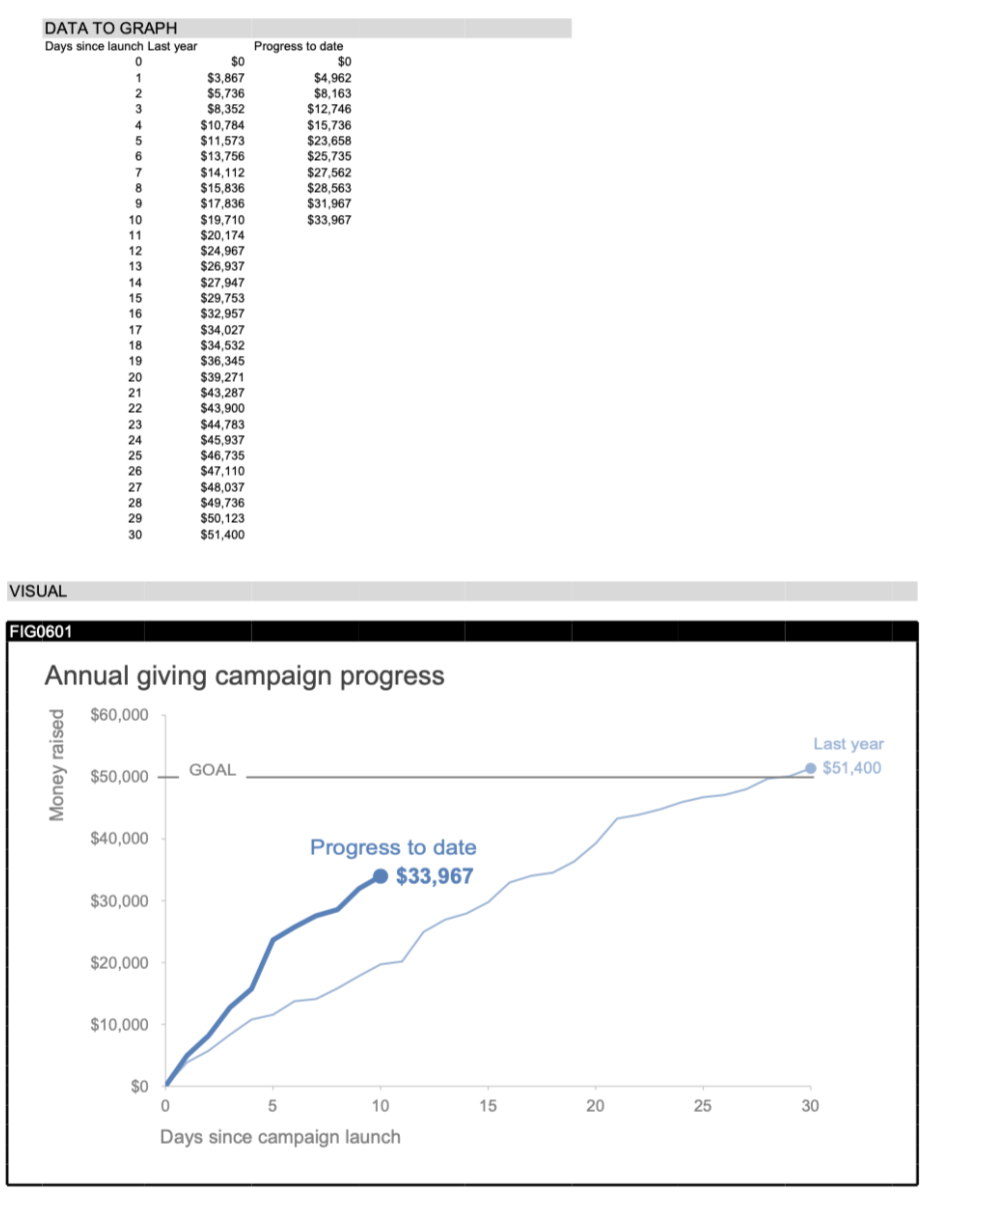
DATA TO GRAPH Days since launch Last year \begin{tabular}{rr} & Progress to date \\ $0 & $0 \\ $3,867 & $4,962 \\ $5,736 & $8,163 \\ $8,352 & $12,746 \\ $10,784 & $15,736 \\ $11,573 & $23,658 \\ $13,756 & $25,735 \\ $14,112 & $27,562 \\ $15,836 & $28,563 \\ $17,836 & $31,967 \\ $19,710 & $33,967 \\ $20,174 & \\ $24,967 & \\ $26,937 & \\ $27,947 & \\ $29,753 & \\ $32,957 & \\ $34,027 & \\ $34,532 & \\ $36,345 & \\ $39,271 & \\ $43,287 & \\ $43,900 & \\ $44,783 & \\ $45,937 & \\ $46,735 & \\ $47,110 & \\ $48,037 & \\ $49,736 & \\ $50,123 & \\ $51,400 & \\ \hline \end{tabular} VISUAL FIG0601 Annual giving campaign progress Days since campaign launch
Step by Step Solution
There are 3 Steps involved in it

Get step-by-step solutions from verified subject matter experts