

Question: Refer an integrated cost and work graph data given in the following table. First draw a integrated cost and time graph along with planned and
Refer an integrated cost and work graph data given in the following table. First draw a integrated cost and time graph along with planned and actual progress data. The total cost and the duration of the project are $200,000 and 200 days. The project is now at 60% complete.
Determine the percentage of under or over budget and percentage of ahead or behind schedule at 50%-time period. Draw lines in the graph to show how you come with these numbers. Also show how much cost overrun or underrun ($ amount) and how many days ahead or behind schedule, the project is on this time period.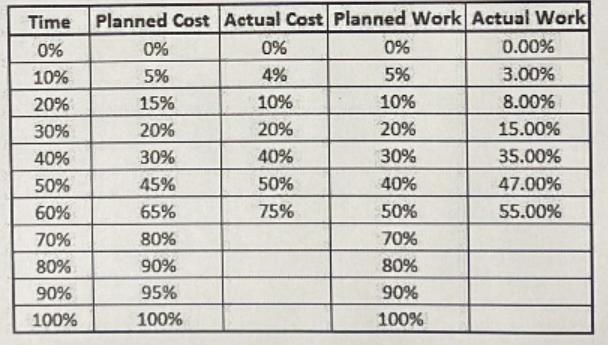
Time Planned Cost Actual Cost Planned Work Actual Work 0% 10% 20% 30% 40% 50% 60% 70% 80% 90% 100% 0% 5% 15% 20% 30% 45% 65% 80% 90% 95% 100% 0% 4% 10% 20% 40% 50% 75% 0% 5% 10% 20% 30% 40% 50% 70% 80% 90% 100% 0.00% 3.00% 8.00% 15.00% 35.00% 47.00% 55.00%
Step by Step Solution
3.44 Rating (154 Votes )
There are 3 Steps involved in it
Solution cost R Work Lin time 100 got 70 60 50 40 30 10 At draw 10 20 graph ove... View full answer

Get step-by-step solutions from verified subject matter experts