

Question: refer attachment for the information QUESTION 3 A random sample of thirty drivers insured with a company and having similar auto insurance policies was selected.
refer attachment for the information
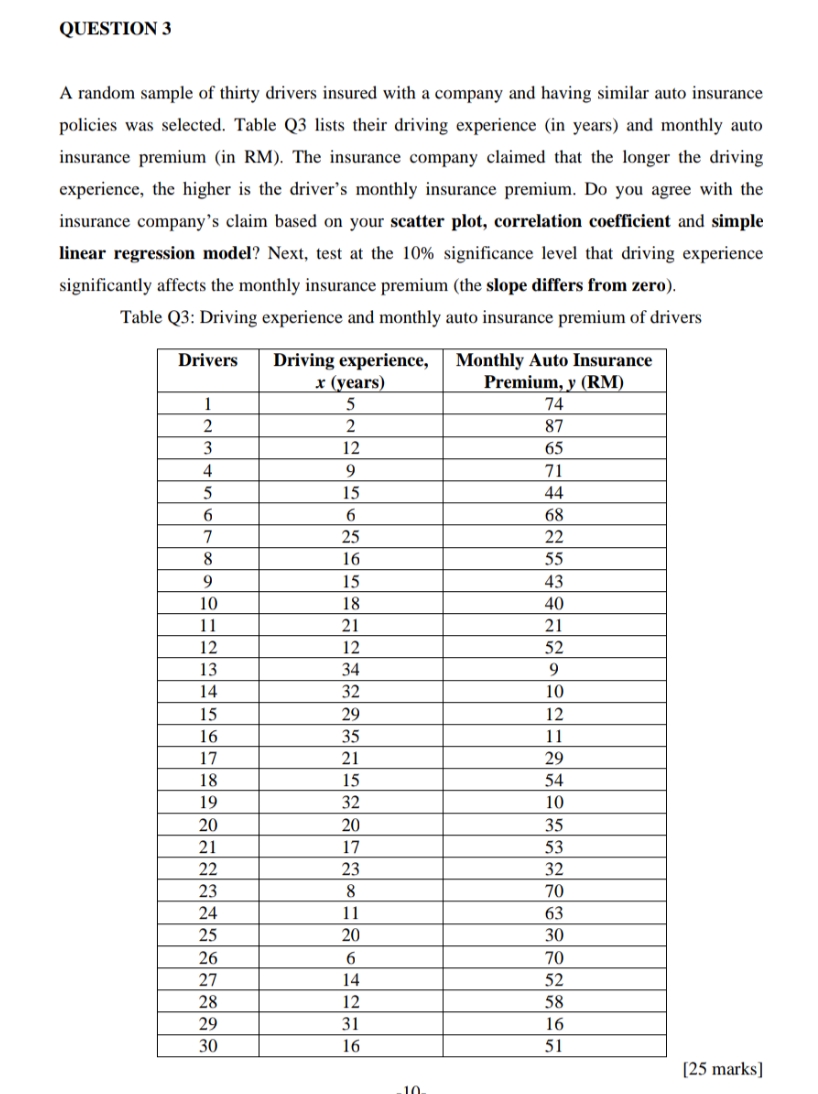
QUESTION 3 A random sample of thirty drivers insured with a company and having similar auto insurance policies was selected. Table Q3 lists their driving experience (in years) and monthly auto insurance premium (in RM). The insurance company claimed that the longer the driving experience, the higher is the driver's monthly insurance premium. Do you agree with the insurance company's claim based on your scatter plot, correlation coefficient and simple linear regression model? Next, test at the 10% significance level that driving experience significantly affects the monthly insurance premium (the slope differs from zero). Table Q3: Driving experience and monthly auto insurance premium of drivers Drivers Driving experience, Monthly Auto Insurance x (years) Premium, y (RM) 5 74 2 2 87 12 65 9 71 15 44 6 68 25 22 8 16 55 9 15 43 10 18 40 11 21 21 12 12 52 13 34 9 14 32 10 15 29 12 16 35 11 17 21 29 18 15 54 19 32 10 20 20 35 21 17 53 22 23 32 23 8 70 24 11 63 25 20 30 26 6 70 27 14 52 28 12 58 29 31 16 30 16 51 [25 marks]
Step by Step Solution
There are 3 Steps involved in it

Get step-by-step solutions from verified subject matter experts