

Question: Refer to Exhibit 1. Perform a discriminant analysis (Analyze> Multivariate Methods>Discriminant) that models Personal Loan as a function of the remaining continuous predictors (Drag the
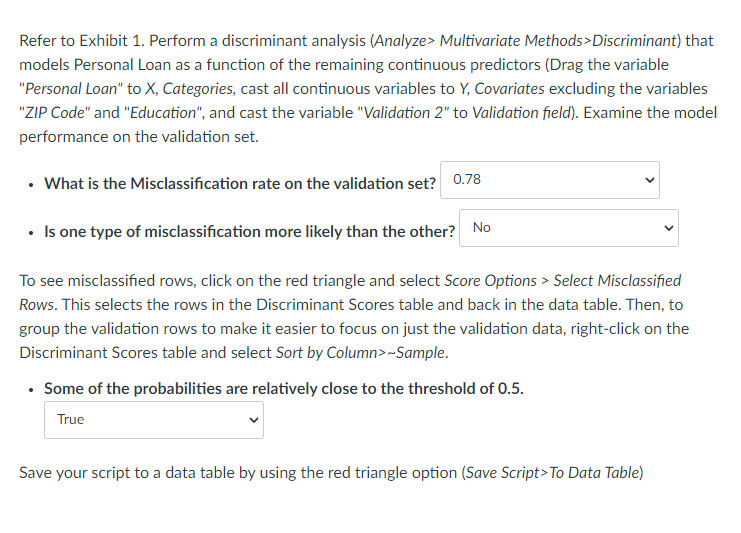
Refer to Exhibit 1. Perform a discriminant analysis (Analyze> Multivariate Methods>Discriminant) that models Personal Loan as a function of the remaining continuous predictors (Drag the variable "Personal Loan" to X, Categories, cast all continuous variables to Y, Covariates excluding the variables "ZIP Code" and "Education", and cast the variable "Validation 2" to Validation field). Examine the model performance on the validation set. . What is the Misclassification rate on the validation set? 0.78 . Is one type of misclassification more likely than the other? No To see misclassified rows, click on the red triangle and select Score Options > Select Misclassified Rows. This selects the rows in the Discriminant Scores table and back in the data table. Then, to group the validation rows to make it easier to focus on just the validation data, right-click on the Discriminant Scores table and select Sort by Column>~Sample. . Some of the probabilities are relatively close to the threshold of 0.5. True Save your script to a data table by using the red triangle option (Save Script> To Data Table)
Step by Step Solution
There are 3 Steps involved in it

Get step-by-step solutions from verified subject matter experts