

Refer to Exhibit 24-3. The profit-maximizing single price monopolist produces output 48. Refer to Exhibit 22-4. Curve
Fantastic news! We've Found the answer you've been seeking!
Question:
Refer to Exhibit 24-3. The profit-maximizing single price monopolist produces output
Transcribed Image Text:
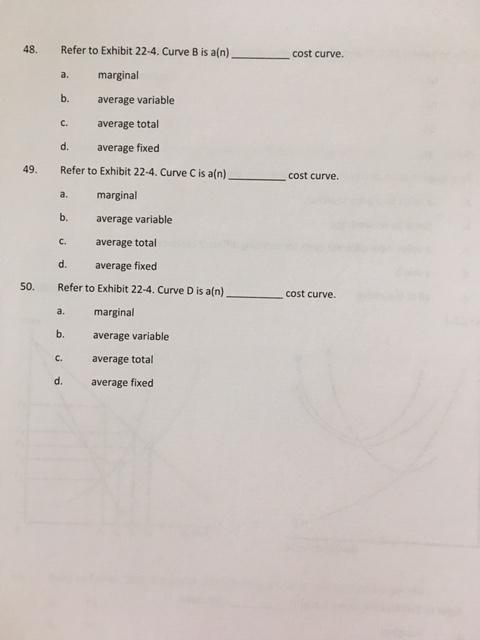
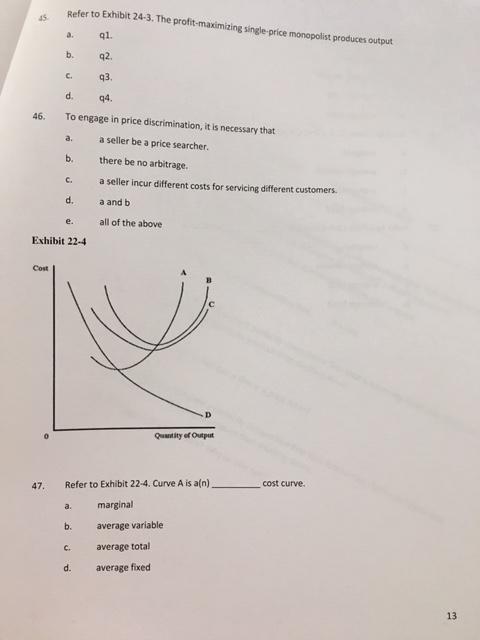
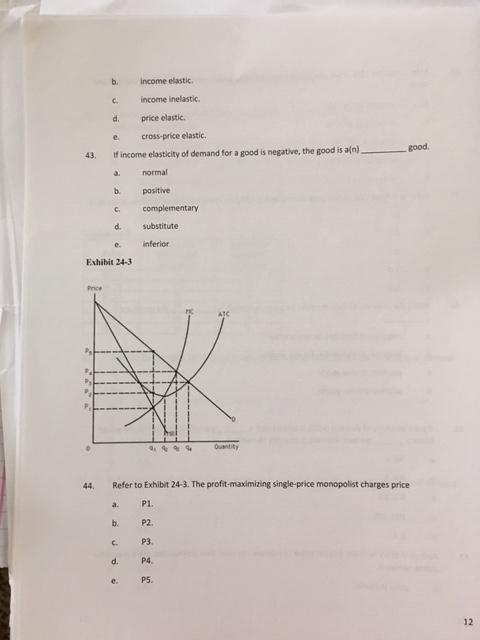
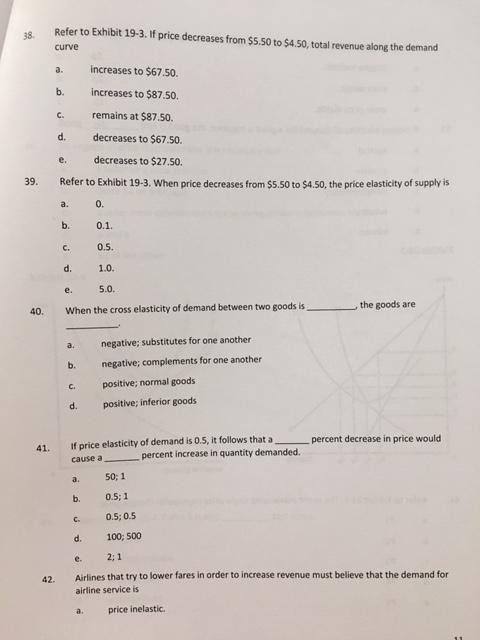
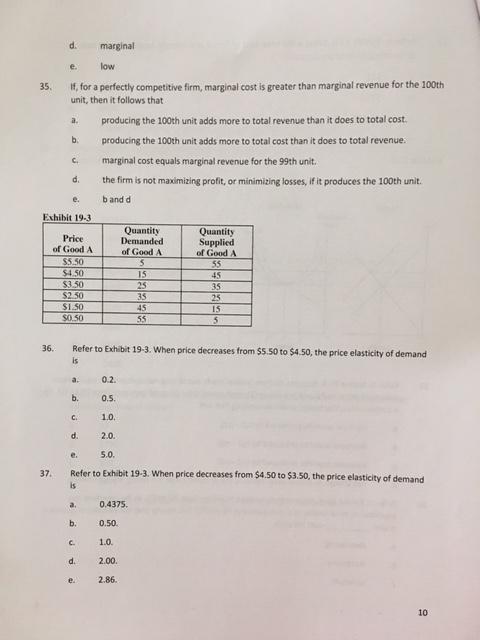
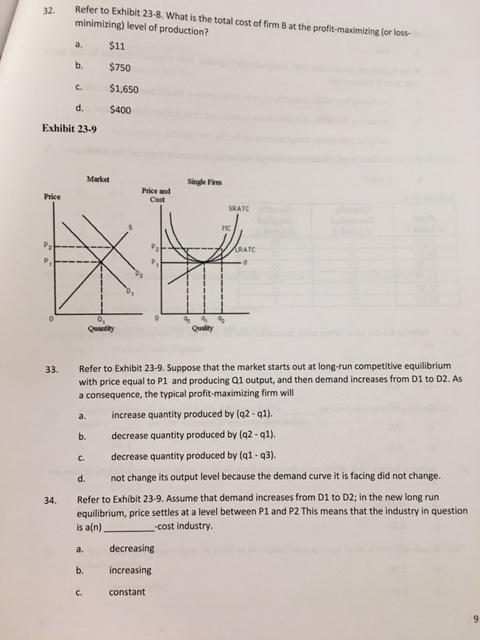
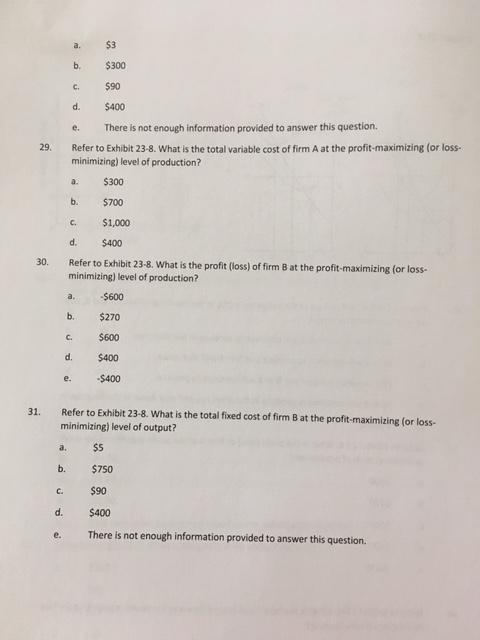
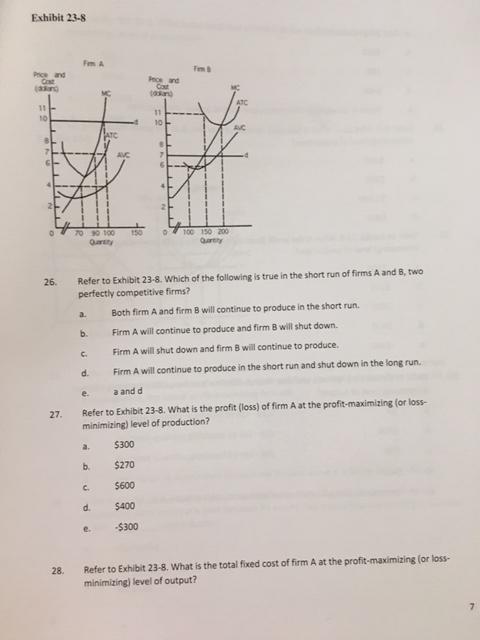
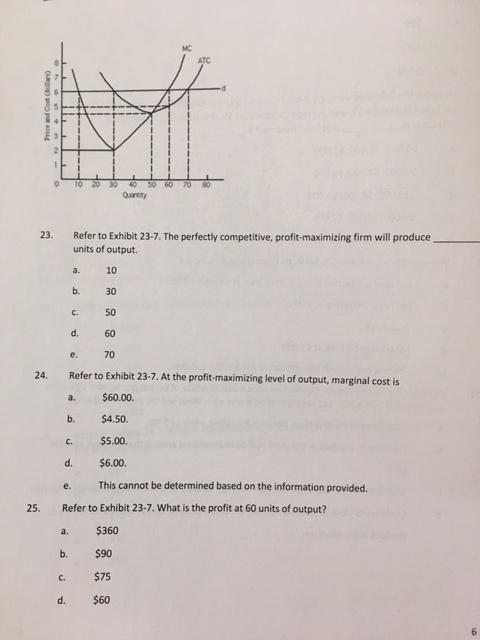
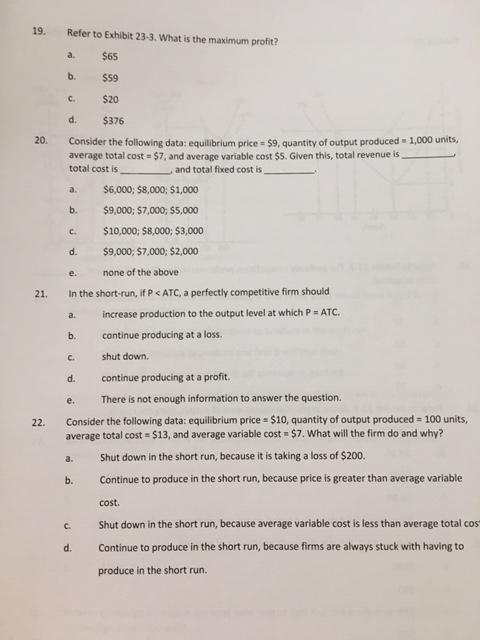
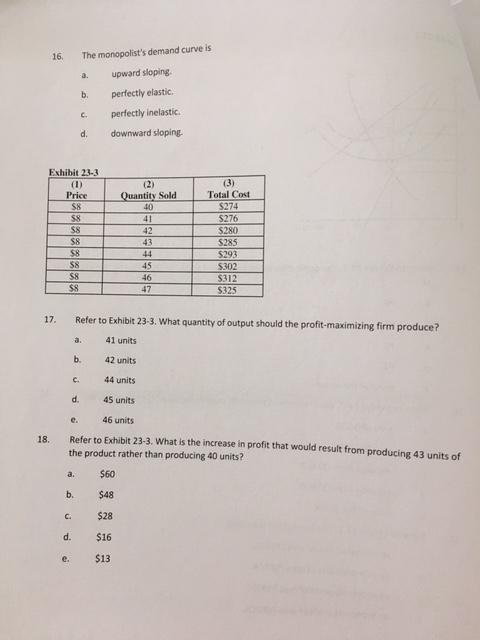
48. Refer to Exhibit 22-4. Curve B is a(n) cost curve. marginal a. b. average variable C. average total d. average fixed 49. Refer to Exhibit 22-4. Curve C is a(n). cost curve. marginal a. b. average variable C. average total d. average fixed 50. Refer to Exhibit 22-4. Curve D is a(n) cost curve. a. marginal b. average variable C. average total d. average fixed Refer to Exhibit 24-3. The profit-maximizing single price monopolist produces output a. q1. b. q2. C. 93. d. q4. 46. To engage in price discrimination, it is necessary that a. a seller be a price searcher. b. there be no arbitrage. C. a seller incur different costs for servicing different customers. d. a and b all of the above e. Exhibit 22-4 Cost Quatity of Output 47. Refer to Exhibit 22-4. Curve A is a(n) cost curve. marginal a. b. average variable C. average total d. average fixed 13 b. income elastic. C. income inelastic. d. price elastic. e. cross-price elastic. good. 43. If income elasticity of demand for a good is negative, the good is aln) a. normal b. positive C. complementary d. substitute e. inferior Exhibit 24-3 Pnce Ouantity 44. Refer to Exhibit 24-3. The profit-maximizing single-price monopolist charges price a. P1. b. P2. C. P3. d. P4. e. P5. 12 Refer to Exhibit 19-3. If price decreases from $5.50 to $4.50, total revenue along the demand 38 curve a. increases to $67.50. b. increases to $87.50. C. remains at $87.50. d. decreases to $67.50. e. decreases to $27.50. 39. Refer to Exhibit 19-3. When price decreases from $5.50 to $4.50, the price elasticity of supply is a. 0. b. 0.1. C. 0.5. d. 1.0. e. 5.0. 40. When the cross elasticity of demand between two goods is the goods are a. negative; substitutes for one another b. negative; complements for one another C. positive; normal goods d. positive; inferior goods If price elasticity of demand is 0.5, it follows that a percent increase in quantity demanded. percent decrease in price would 41. cause a 50; 1 a. b. 0.5; 1 C. 0.5; 0.5 d. 100; S00 e. 2; 1 42. Airlines that try to lower fares in order to increase revenue must believe that the demand for airline service is price inelastic. a. d. marginal e. low If, for a perfectly competitive firm, marginal cost is greater than marginal revenue for the 100th unit, then it follows that 35. producing the 100th unit adds more to total revenue than it does to total cost. a. b. producing the 100th unit adds more to total cost than it does to total revenue. C. marginal cost equals marginal revenue for the 99th unit. d. the firm is not maximizing profit, or minimizing losses, if it produces the 100th unit. band d e. Exhibit 19-3 Quantity Demanded of Good A Quantity Supplied of Good A 55 Price of Good A $5.50 $4.50 15 45 $3.50 25 35 35 25 $2.50 S1.50 $0.50 15 55 36. Refer to Exhibit 19-3. When price decreases from $5.50 to $4.50, the price elasticity of demand is a. 0.2. b. 0.5. C. 1.0. d. 2.0. e. 5.0. 37. Refer to Exhibit 19-3. When price decreases from $4.50 to $3.50, the price elasticity of demand is a. 0.4375. b. 0.50. C. 1.0. d. 2.00. e. 2.86. 10 Refer to Exhibit 23-8. What is the total cost of firm B at the profit-maximizing lor loss minimizing) level of production? 32. a. $1 b. $750 C. $1,650 d. $400 Exhibit 23-9 Market Single Fim Price and Con Price SRATC RATC Quatity Quality Refer to Exhibit 23-9. Suppose that the market starts out at long-run competitive equilibrium with price equal to P1 and producing Q1 output, and then demand increases from D1 to D2. As a consequence, the typical profit-maximizing firm will 33. a. increase quantity produced by (q2 - q1). b. decrease quantity produced by (q2 - q1). C. decrease quantity produced by (q1 - q3). d. not change its output level because the demand curve it is facing did not change. Refer to Exhibit 23-9. Assume that demand increases from D1 to D2; in the new long run equilibrium, price settles at a level between P1 and P2 This means that the Industry in question is a(n) 34. -cost industry. decreasing a. b. increasing C. constant 9. a. $3 b. $300 C. $90 d. $400 There is not enough information provided to answer this question. e. 29. Refer to Exhibit 23-8. What is the total variable cost of firm A at the profit-maximizing (or loss- minimizing) level of production? a. $300 b. $700 c. $1,000 d. $400 30. Refer to Exhibit 23-8. What is the profit (loss) of firm B at the profit-maximizing (or loss- minimizing) level of production? a, -S600 b. $270 C. $600 d. $400 e. -$400 31. Refer to Exhibit 23-8. What is the total fixed cost of firm B at the profit-maximizing (or loss- minimizing) level of output? a. b. $750 C. $90 d. $400 There is not enough information provided to answer this question. e. Exhibit 23-8 Fm A Tm Pice and Cost Pece and Cost takan 11 10 10 AVC 70 0 100 150 100 150 200 Qartty Oarty Refer to Exhibit 23-8. Which of the following is true in the short run of firms A and 8, two perfectly competitive firms? 26. a. Both firm A and firm B will continue to produce in the short run. b. Firm A will continue to produce and firm B will shut down. C. Firm A will shut down and firm 8 will continue to produce. d. Firm A will continue to produce in the short run and shut down in the long run. e. a and d Refer to Exhibit 23-8. What is the profit (loss) of firm A at the profit-maximizing (or loss- minimizing) level of production? 27. a. $300 b. $270 C. $600 d. $400 e. -$300 Refer to Exhibit 23-8. What is the total fixed cost of firm A at the profit-maximizing (or loss- minimizing) level of output? 28. 10 20 30 40 50 60 70 போ 23. Refer to Exhibit 23-7. The perfectly competitive, profit-maximizing firm will produce units of output. a. 10 b. 30 C. 50 d. 60 e. 70 24. Refer to Exhibit 23-7. At the profit-maximizing level of output, marginal cost is a. $60.00. b. $4.50. C. $5.00. d. $6.00. e. This cannot be determined based on the information provided. 25. Refer to Exhibit 23-7. What is the profit at 60 units of output? a. $360 b. $90 C. $75 d. $60 6. Price and Cost (dellar) 19. Refer to Exhibit 23-3. What is the maximum profit? a. $65 b. $9 C. $20 d. $376 Consider the following data: equilibrium price = $9, quantity of output produced = 1,000 units, average total cost $7, and average variable cost $5. Given this, total revenue is total cost is 20. and total fixed cost is a. $6,000; $8,000; $1,000 b. $9,000; $7,000; $5,000 C. $10,000; $8,000; $3,000 d. $9,000; $7,000; $2,000 e. none of the above 21. In the short-run, if P< ATC, a perfectly competitive firm should increase production to the output level at which P ATC. a. b. continue producing at a loss. C. shut down. d. continue producing at a profit. e. There is not enough information to answer the question. Consider the following data: equilibrium price = $10, quantity of output produced = 100 units, average total cost = $13, and average variable cost = $7. What will the firm do and why? 22. Shut down in the short run, because it is taking a loss of $200. a. b. Continue to produce in the short run, because price is greater than average variable cost. C. Shut down in the short run, because average variable cost is less than average total cos d. Continue to produce in the short run, because firms are always stuck with having to produce in the short run. 16. The monopolist's demand curve is a. upward sloping b. perfectly elastic C. perfectly inelastic. d. downward sloping. Exhibit 23-3 (2) Quantity Sold 40 (3) Total Cost (1) Price $8 $274 S8 S8 S8 $8 $8 41 $276 42 $280 43 $285 $293 $302 44 45 $8 46 $312 $325 $8 47 17. Refer to Exhibit 23-3. What quantity of output should the profit-maximizing firm produce? a. 41 units b. 42 units C. 44 units d. 45 units e. 46 units 18. Refer to Exhibit 23-3. What is the increase in profit that would result from producing 43 units of the product rather than producing 40 units? a. $60 b. $48 C. $28 d. $16 e. $13 48. Refer to Exhibit 22-4. Curve B is a(n) cost curve. marginal a. b. average variable C. average total d. average fixed 49. Refer to Exhibit 22-4. Curve C is a(n). cost curve. marginal a. b. average variable C. average total d. average fixed 50. Refer to Exhibit 22-4. Curve D is a(n) cost curve. a. marginal b. average variable C. average total d. average fixed Refer to Exhibit 24-3. The profit-maximizing single price monopolist produces output a. q1. b. q2. C. 93. d. q4. 46. To engage in price discrimination, it is necessary that a. a seller be a price searcher. b. there be no arbitrage. C. a seller incur different costs for servicing different customers. d. a and b all of the above e. Exhibit 22-4 Cost Quatity of Output 47. Refer to Exhibit 22-4. Curve A is a(n) cost curve. marginal a. b. average variable C. average total d. average fixed 13 b. income elastic. C. income inelastic. d. price elastic. e. cross-price elastic. good. 43. If income elasticity of demand for a good is negative, the good is aln) a. normal b. positive C. complementary d. substitute e. inferior Exhibit 24-3 Pnce Ouantity 44. Refer to Exhibit 24-3. The profit-maximizing single-price monopolist charges price a. P1. b. P2. C. P3. d. P4. e. P5. 12 Refer to Exhibit 19-3. If price decreases from $5.50 to $4.50, total revenue along the demand 38 curve a. increases to $67.50. b. increases to $87.50. C. remains at $87.50. d. decreases to $67.50. e. decreases to $27.50. 39. Refer to Exhibit 19-3. When price decreases from $5.50 to $4.50, the price elasticity of supply is a. 0. b. 0.1. C. 0.5. d. 1.0. e. 5.0. 40. When the cross elasticity of demand between two goods is the goods are a. negative; substitutes for one another b. negative; complements for one another C. positive; normal goods d. positive; inferior goods If price elasticity of demand is 0.5, it follows that a percent increase in quantity demanded. percent decrease in price would 41. cause a 50; 1 a. b. 0.5; 1 C. 0.5; 0.5 d. 100; S00 e. 2; 1 42. Airlines that try to lower fares in order to increase revenue must believe that the demand for airline service is price inelastic. a. d. marginal e. low If, for a perfectly competitive firm, marginal cost is greater than marginal revenue for the 100th unit, then it follows that 35. producing the 100th unit adds more to total revenue than it does to total cost. a. b. producing the 100th unit adds more to total cost than it does to total revenue. C. marginal cost equals marginal revenue for the 99th unit. d. the firm is not maximizing profit, or minimizing losses, if it produces the 100th unit. band d e. Exhibit 19-3 Quantity Demanded of Good A Quantity Supplied of Good A 55 Price of Good A $5.50 $4.50 15 45 $3.50 25 35 35 25 $2.50 S1.50 $0.50 15 55 36. Refer to Exhibit 19-3. When price decreases from $5.50 to $4.50, the price elasticity of demand is a. 0.2. b. 0.5. C. 1.0. d. 2.0. e. 5.0. 37. Refer to Exhibit 19-3. When price decreases from $4.50 to $3.50, the price elasticity of demand is a. 0.4375. b. 0.50. C. 1.0. d. 2.00. e. 2.86. 10 Refer to Exhibit 23-8. What is the total cost of firm B at the profit-maximizing lor loss minimizing) level of production? 32. a. $1 b. $750 C. $1,650 d. $400 Exhibit 23-9 Market Single Fim Price and Con Price SRATC RATC Quatity Quality Refer to Exhibit 23-9. Suppose that the market starts out at long-run competitive equilibrium with price equal to P1 and producing Q1 output, and then demand increases from D1 to D2. As a consequence, the typical profit-maximizing firm will 33. a. increase quantity produced by (q2 - q1). b. decrease quantity produced by (q2 - q1). C. decrease quantity produced by (q1 - q3). d. not change its output level because the demand curve it is facing did not change. Refer to Exhibit 23-9. Assume that demand increases from D1 to D2; in the new long run equilibrium, price settles at a level between P1 and P2 This means that the Industry in question is a(n) 34. -cost industry. decreasing a. b. increasing C. constant 9. a. $3 b. $300 C. $90 d. $400 There is not enough information provided to answer this question. e. 29. Refer to Exhibit 23-8. What is the total variable cost of firm A at the profit-maximizing (or loss- minimizing) level of production? a. $300 b. $700 c. $1,000 d. $400 30. Refer to Exhibit 23-8. What is the profit (loss) of firm B at the profit-maximizing (or loss- minimizing) level of production? a, -S600 b. $270 C. $600 d. $400 e. -$400 31. Refer to Exhibit 23-8. What is the total fixed cost of firm B at the profit-maximizing (or loss- minimizing) level of output? a. b. $750 C. $90 d. $400 There is not enough information provided to answer this question. e. Exhibit 23-8 Fm A Tm Pice and Cost Pece and Cost takan 11 10 10 AVC 70 0 100 150 100 150 200 Qartty Oarty Refer to Exhibit 23-8. Which of the following is true in the short run of firms A and 8, two perfectly competitive firms? 26. a. Both firm A and firm B will continue to produce in the short run. b. Firm A will continue to produce and firm B will shut down. C. Firm A will shut down and firm 8 will continue to produce. d. Firm A will continue to produce in the short run and shut down in the long run. e. a and d Refer to Exhibit 23-8. What is the profit (loss) of firm A at the profit-maximizing (or loss- minimizing) level of production? 27. a. $300 b. $270 C. $600 d. $400 e. -$300 Refer to Exhibit 23-8. What is the total fixed cost of firm A at the profit-maximizing (or loss- minimizing) level of output? 28. 10 20 30 40 50 60 70 போ 23. Refer to Exhibit 23-7. The perfectly competitive, profit-maximizing firm will produce units of output. a. 10 b. 30 C. 50 d. 60 e. 70 24. Refer to Exhibit 23-7. At the profit-maximizing level of output, marginal cost is a. $60.00. b. $4.50. C. $5.00. d. $6.00. e. This cannot be determined based on the information provided. 25. Refer to Exhibit 23-7. What is the profit at 60 units of output? a. $360 b. $90 C. $75 d. $60 6. Price and Cost (dellar) 19. Refer to Exhibit 23-3. What is the maximum profit? a. $65 b. $9 C. $20 d. $376 Consider the following data: equilibrium price = $9, quantity of output produced = 1,000 units, average total cost $7, and average variable cost $5. Given this, total revenue is total cost is 20. and total fixed cost is a. $6,000; $8,000; $1,000 b. $9,000; $7,000; $5,000 C. $10,000; $8,000; $3,000 d. $9,000; $7,000; $2,000 e. none of the above 21. In the short-run, if P< ATC, a perfectly competitive firm should increase production to the output level at which P ATC. a. b. continue producing at a loss. C. shut down. d. continue producing at a profit. e. There is not enough information to answer the question. Consider the following data: equilibrium price = $10, quantity of output produced = 100 units, average total cost = $13, and average variable cost = $7. What will the firm do and why? 22. Shut down in the short run, because it is taking a loss of $200. a. b. Continue to produce in the short run, because price is greater than average variable cost. C. Shut down in the short run, because average variable cost is less than average total cos d. Continue to produce in the short run, because firms are always stuck with having to produce in the short run. 16. The monopolist's demand curve is a. upward sloping b. perfectly elastic C. perfectly inelastic. d. downward sloping. Exhibit 23-3 (2) Quantity Sold 40 (3) Total Cost (1) Price $8 $274 S8 S8 S8 $8 $8 41 $276 42 $280 43 $285 $293 $302 44 45 $8 46 $312 $325 $8 47 17. Refer to Exhibit 23-3. What quantity of output should the profit-maximizing firm produce? a. 41 units b. 42 units C. 44 units d. 45 units e. 46 units 18. Refer to Exhibit 23-3. What is the increase in profit that would result from producing 43 units of the product rather than producing 40 units? a. $60 b. $48 C. $28 d. $16 e. $13
Expert Answer:
Answer rating: 100% (QA)
As the image is blurry i am not able to see the graph naming properly i am re creating the graph and ... View the full answer

Related Book For 

Posted Date:
Students also viewed these economics questions
-
Refer to Exhibit 24-3. The profit-maximizing single price monopolist produces output a. Q1. b. 92 C. q3. d. q4. To engage in price discrimination, it is necessary that 46 . a seller be a price...
-
Refer to the Excel output shown in Exhibit 14.32 above. Is the overall model significant? You will have to estimate the p-value from the tables at the back of the text. Use a 5% level of...
-
Refer to the Excel output shown in Exhibit 14.32 above. Test the individual coefficients for significance. Use a 5% level of significance. SUMMARY OUTPUT Regression Statistics Multiple R R Square...
-
2. National Defense (40 points). There are 11 countries in Europe who get utility from general consumption c, and from European national defense G. The utility of a generic country i is u(ci, G) =...
-
Creative Computing sells a tablet computer called the Protab. The $780 sales price of a Protab Package includes the following: ¢ One Protab computer. ¢ A 6-month limited warranty. This...
-
For the bar hanging under its own weight shown in Figure P3-57, determine the nodal displacements using (a) Two equal-length elements and (b) Four equal-length elements. Let A = 2 in2, E = 30...
-
True or False: If \(\operatorname{IRR}(\mathrm{A})>\operatorname{IRR}(\mathrm{B})\), then \(\operatorname{ERR}(\mathrm{A})>\operatorname{ERR}(\mathrm{B})\).
-
The Wetski Water Ski Company is the worlds largest producer of water skis. As you might suspect, water skis exhibit a highly seasonal demand pattern, with peaks during the summer months and valleys...
-
3 3. 7 of the coins in a box are nickels. The rest are dimes. If there are 24 dimes, how many nickels are there?
-
The following information, taken from the books of Herman Brothers Manufacturing represents the operations for January: The job cost system is used, and the February cost sheet for Job M45 shows the...
-
Classify all critical values of the equation, = 12 - 6y+8, as asymptotically stable, unstable, or semi-stable.
-
When is a set of DFDs balanced (i.e., leveled)?
-
Name the four IT resources as delineated by COBIT.
-
What are the three components of the SQL SELECT statement?
-
What are the characteristics of recursive relationships that distinguish them from other types of relationships?
-
What are the four major categories of pervasive controls? Why would the PCAOB refer to these controls as entity level?
-
64 men can complete a piece of work in 40 days. In how many days can 32 men complete the same piece of work?
-
Difference between truncate & delete
-
Give illustrations from the opening case in this chapter of how both microeconomic and macroeconomic factors influence the global automobile industry.
-
Explain the differences between the inputs and outputs of a production process.
-
The following discussion focuses on the change in production and selling strategies of Timken Co., the Canton, Ohio, firm that is a major producer of bearings:64 To counter the low prices of imports,...
-
Do any problems arise when translating physical assets and economic events into monetary units? Give one or two illustrations to support your answer.
-
Entries for the Warren Clinic 2015 income statement are listed below in alphabetical order. Reorder the data in proper format. Depreciation expense General/administrative expenses Interest expense $...
-
Brandywine Homecare, a not-for-profit business, had revenues of \($12\) million in 2015. Expenses other than depreciation totaled 75 percent of revenues, and depreciation expense was \($1.5\)...

Study smarter with the SolutionInn App