

Question: Refer to Scenario A. What should the first point plothed ori the R-chart be? Pick the closent arswed 255075100125150 Hpotris on each of the frve
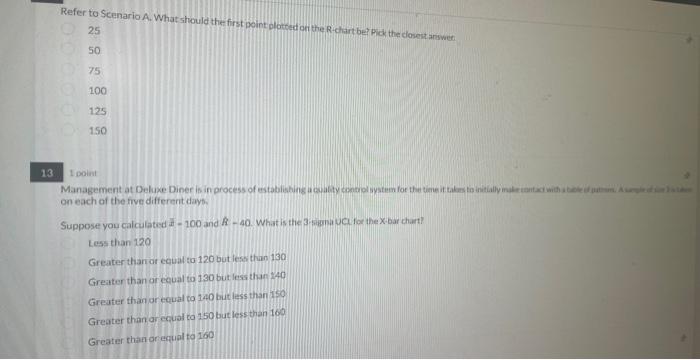
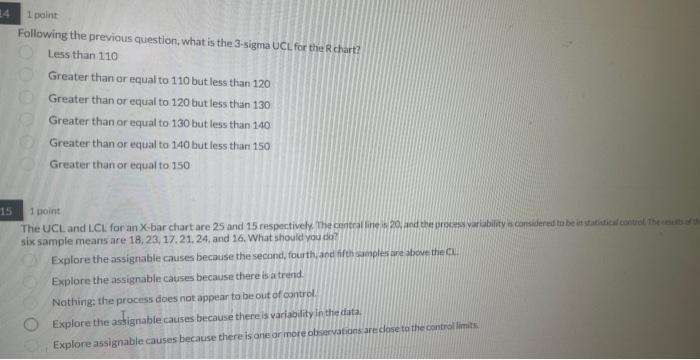
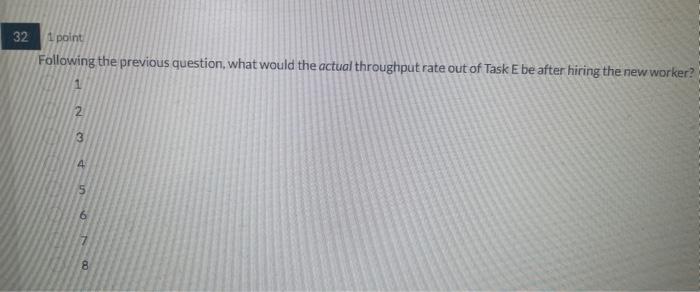
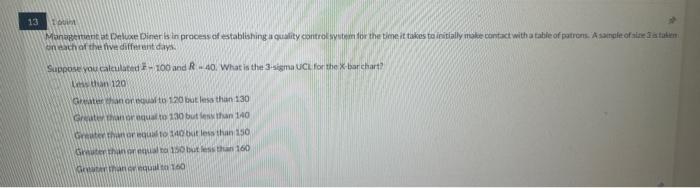
Refer to Scenario A. What should the first point plothed ori the R-chart be? Pick the closent arswed 255075100125150 Hpotris on each of the frve differerit dayts Suppose you calculatiod at -100 and A40. What is the 3ishand ver for the x bar chart? Lessthan 120 Greater than or ecual to 120 but less thaen 130 Greater than ar ecual to 130 but less than 400 Greater than ar equal to 140 but less than isil Greater than ar ceual co 150 buc less than 160 Greater than or equal to 160 Following the previous question, what is the 3 -sigma UCL for the R chart? Less than 110 Greater than or equal to 110 but less than 120 Greater than or equal to 120 but less than 130 Greater than or equal to 130 but less than 140 Greater than or equal to 140 but less than 150 Greater than or equal to 150 1 point sib sample means are 18,23,17,21,24, and 16 . What should you dia? Explore the assignable causes because the second, fourth, and fif w wimples are bbove the C. Explore the assignable causes because there is atrend. Nothing; the process does not appear to be out of control. Explore the astignable causes because thereis variability in the dita. Explore assignable causes because there is one or inore obsaevations are close to the control limite Following the previous question, what would the actual throughput rate out of Task E be after hiring the new worker? 1 2 3 4 15 6 7 8 g.Wiver fonn or ecuar to 120 bek less than 130 Grfater mameroqual io 130 bot insyifan 1 AO Gevece hemer equal to 14ewout less than 150 Ghwuter thaner eaual ta 1so but less ehar 160 Whement thate ovequal ta 160 Following the previous question, what is the 3-sigma UCL for the R chart? Less than 110 Greater than or equal to 110 but less than 120 Greater than or equal to 120 but less than 130 Greater than or equal to 130 but less than 140 Greater than or equal to 140 but less than 150 Greater than or equal to 150 Refer to Scenario A. What should the first point plothed ori the R-chart be? Pick the closent arswed 255075100125150 Hpotris on each of the frve differerit dayts Suppose you calculatiod at -100 and A40. What is the 3ishand ver for the x bar chart? Lessthan 120 Greater than or ecual to 120 but less thaen 130 Greater than ar ecual to 130 but less than 400 Greater than ar equal to 140 but less than isil Greater than ar ceual co 150 buc less than 160 Greater than or equal to 160 Following the previous question, what is the 3 -sigma UCL for the R chart? Less than 110 Greater than or equal to 110 but less than 120 Greater than or equal to 120 but less than 130 Greater than or equal to 130 but less than 140 Greater than or equal to 140 but less than 150 Greater than or equal to 150 1 point sib sample means are 18,23,17,21,24, and 16 . What should you dia? Explore the assignable causes because the second, fourth, and fif w wimples are bbove the C. Explore the assignable causes because there is atrend. Nothing; the process does not appear to be out of control. Explore the astignable causes because thereis variability in the dita. Explore assignable causes because there is one or inore obsaevations are close to the control limite Following the previous question, what would the actual throughput rate out of Task E be after hiring the new worker? 1 2 3 4 15 6 7 8 g.Wiver fonn or ecuar to 120 bek less than 130 Grfater mameroqual io 130 bot insyifan 1 AO Gevece hemer equal to 14ewout less than 150 Ghwuter thaner eaual ta 1so but less ehar 160 Whement thate ovequal ta 160 Following the previous question, what is the 3-sigma UCL for the R chart? Less than 110 Greater than or equal to 110 but less than 120 Greater than or equal to 120 but less than 130 Greater than or equal to 130 but less than 140 Greater than or equal to 140 but less than 150 Greater than or equal to 150
Step by Step Solution
There are 3 Steps involved in it

Get step-by-step solutions from verified subject matter experts