

Question: Refer to Table S6.1 - Factors for Computing Control Chart Limits (3 sigma) for this problem. West Battery Corp. has recently been receiving complaints from
Refer to
Table S6.1 - Factors for Computing Control Chart Limits (3 sigma) for this problem.
West Battery Corp. has recently been receiving complaints from retailers that its 9-volt batteries are not lasting as long as other name brands. James West, head of the TQM program at West's Austin plant, believes there is no problem because his batteries have had an average life of 50 hours, about 10% longer than competitors' models. To raise the lifetime above this level would require a new level of technology not available to West. Nevertheless, he is concerned enough to set up hourly assembly line checks. Previously, after ensuring that the process was running properly, West took samples of
5
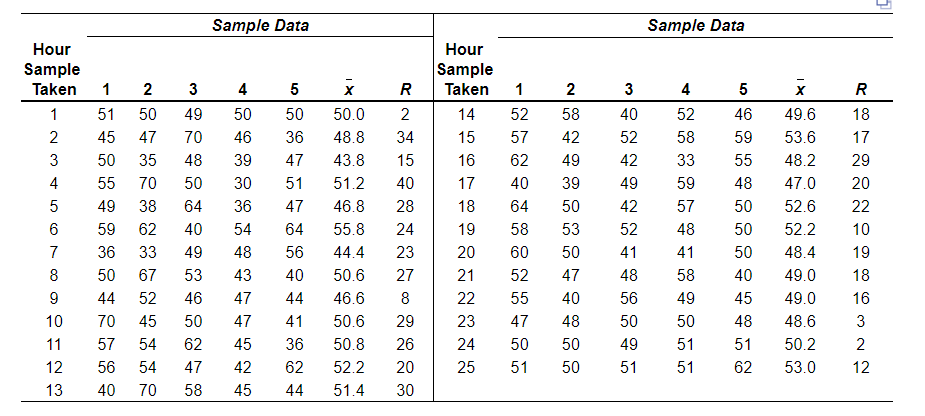
9-volt batteries for 25 test to establish the standards for control chart limits. Those 25 tests are shown in the following table:
Hour Sample Taken Xbar R Hour Sample Taken Xbar R 1 50.0 2 14 49.6 18 2 48.8 34 15 53.6 17 3 43.8 15 16 48.2 29 4 51.2 40 17 47.0 20 5 46.8 28 18 52.6 22 6 55.8 24 19 52.2 10 7 44.4 23 20 48.4 19 8 50.6 27 21 49.0 18 9 46.6 8 22 49.0 16 10 50.6 29 23 48.6 3 11 50.8 26 24 50.2 2 12 52.2 20 25 53.0 12 13 51.4 30
 This exercise contains only parts a and b.
Please solve all questions correctly
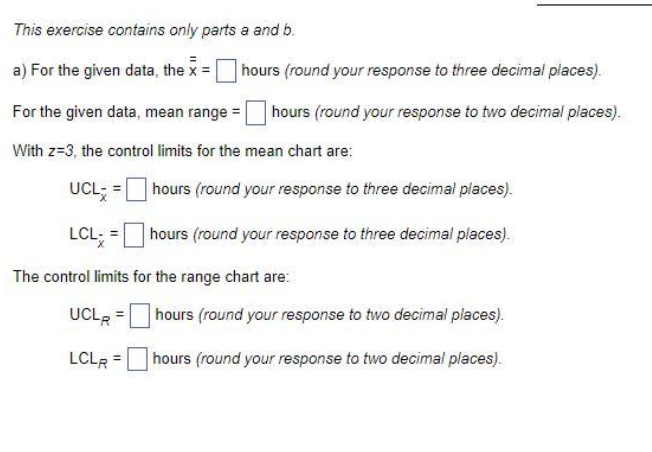
\begin{tabular}{|c|c|c|c|c|c|c|c|c|c|c|c|c|c|c|c|} \hline \multirow[b]{2}{*}{HourSampleTaken} & \multicolumn{7}{|c|}{ Sample Data } & \multirow[b]{2}{*}{\begin{tabular}{|c} Hour \\ Sample \\ Taken \\ \end{tabular}} & \multicolumn{7}{|c|}{ Sample Data } \\ \hline & 1 & 2 & 3 & 4 & 5 & x & R & & 1 & 2 & 3 & 4 & 5 & x & R \\ \hline 1 & 51 & 50 & 49 & 50 & 50 & 50.0 & 2 & 14 & 52 & 58 & 40 & 52 & 46 & 49.6 & 18 \\ \hline 2 & 45 & 47 & 70 & 46 & 36 & 48.8 & 34 & 15 & 57 & 42 & 52 & 58 & 59 & 53.6 & 17 \\ \hline 3 & 50 & 35 & 48 & 39 & 47 & 43.8 & 15 & 16 & 62 & 49 & 42 & 33 & 55 & 48.2 & 29 \\ \hline 4 & 55 & 70 & 50 & 30 & 51 & 51.2 & 40 & 17 & 40 & 39 & 49 & 59 & 48 & 47.0 & 20 \\ \hline 5 & 49 & 38 & 64 & 36 & 47 & 46.8 & 28 & 18 & 64 & 50 & 42 & 57 & 50 & 52.6 & 22 \\ \hline 6 & 59 & 62 & 40 & 54 & 64 & 55.8 & 24 & 19 & 58 & 53 & 52 & 48 & 50 & 52.2 & 10 \\ \hline 7 & 36 & 33 & 49 & 48 & 56 & 44.4 & 23 & 20 & 60 & 50 & 41 & 41 & 50 & 48.4 & 19 \\ \hline 8 & 50 & 67 & 53 & 43 & 40 & 50.6 & 27 & 21 & 52 & 47 & 48 & 58 & 40 & 49.0 & 18 \\ \hline 9 & 44 & 52 & 46 & 47 & 44 & 46.6 & 8 & 22 & 55 & 40 & 56 & 49 & 45 & 49.0 & 16 \\ \hline 10 & 70 & 45 & 50 & 47 & 41 & 50.6 & 29 & 23 & 47 & 48 & 50 & 50 & 48 & 48.6 & 3 \\ \hline 11 & 57 & 54 & 62 & 45 & 36 & 50.8 & 26 & 24 & 50 & 50 & 49 & 51 & 51 & 50.2 & 2 \\ \hline 12 & 56 & 54 & 47 & 42 & 62 & 52.2 & 20 & 25 & 51 & 50 & 51 & 51 & 62 & 53.0 & 12 \\ \hline 13 & 40 & 70 & 58 & 45 & 44 & 51.4 & 30 & & & & & & & & \\ \hline \end{tabular} This exercise contains only parts a and b. a) For the given data, the x= hours (round your response to three decimal places). For the given data, mean range = hours (round your response to two decimal places). With z=3, the control limits for the mean chart are: UCL=hours(roundyourresponsetothreedecimalplaces).LCLx=hours(roundyourresponsetothreedecimalplaces). The control limits for the range chart are: UCLR= hours (round your response to two decimal places). LCLR= hours (round your response to two decimal places)
Step by Step Solution
There are 3 Steps involved in it

Get step-by-step solutions from verified subject matter experts