

Question: Refer to Table S6.1 - Factors for Computing_Control Chart Limits (3 sigma) for this problem. Twelve samples, each containing five parts, were taken from a
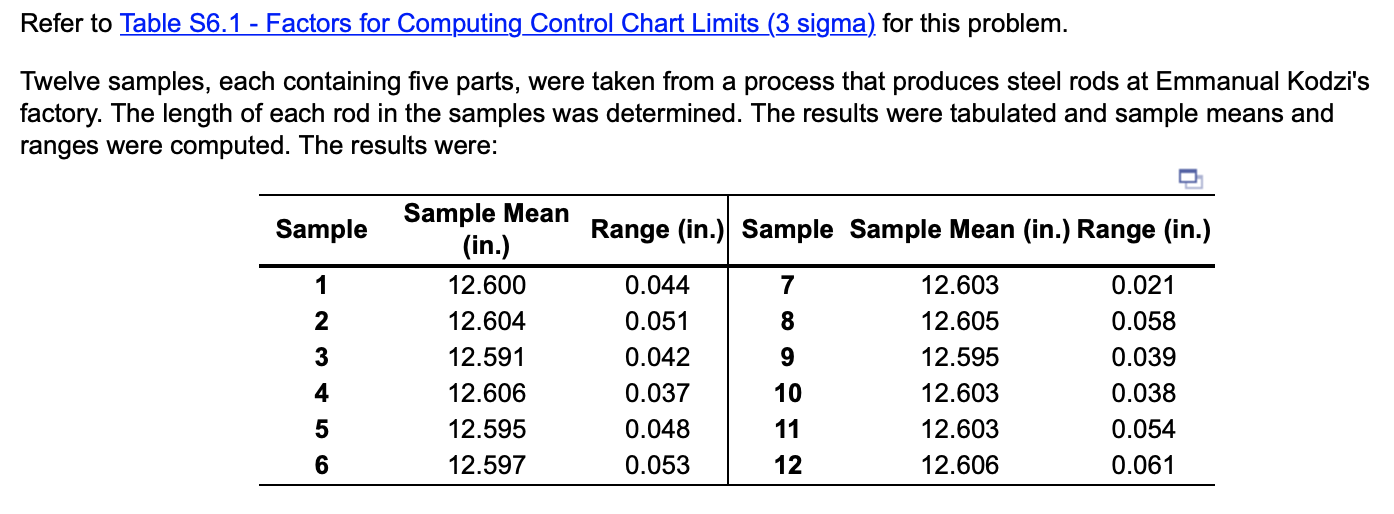
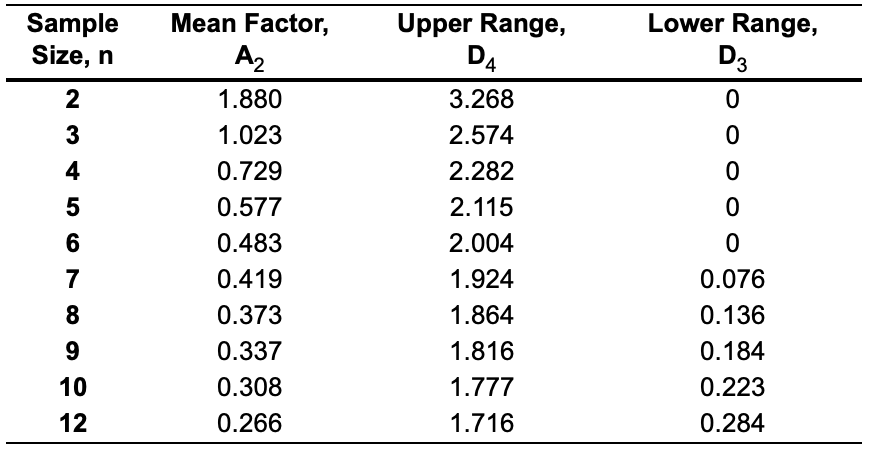
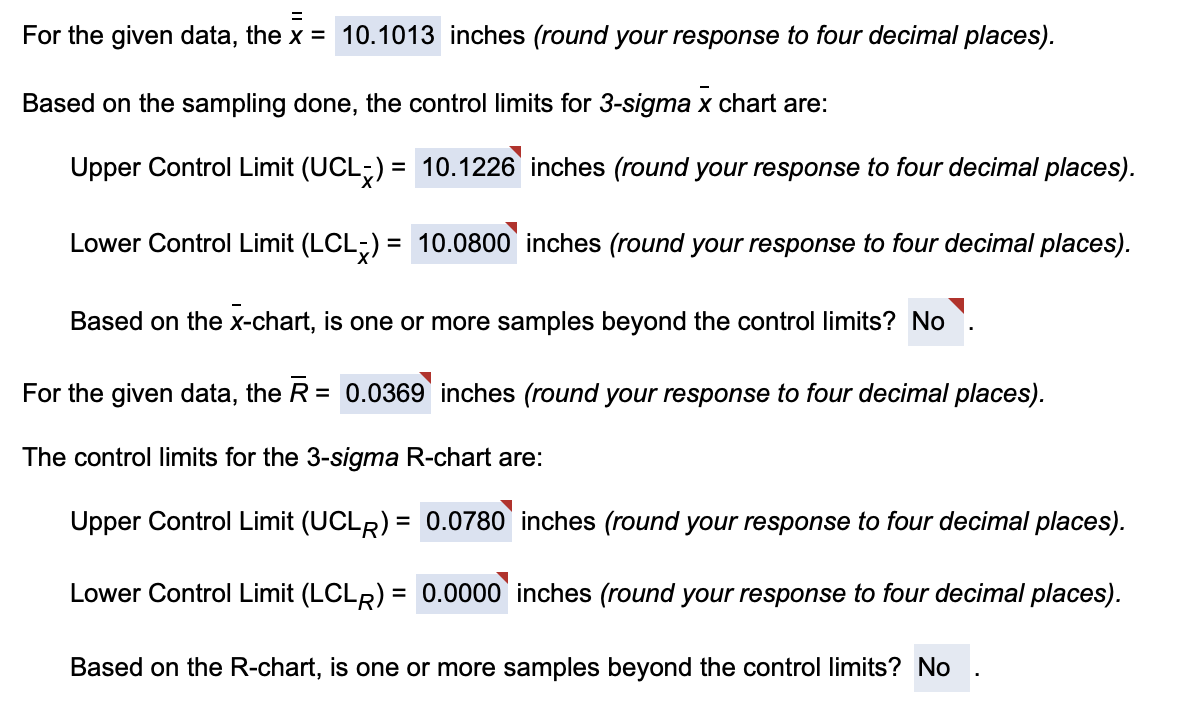
Refer to Table S6.1 - Factors for Computing_Control Chart Limits (3 sigma) for this problem. Twelve samples, each containing five parts, were taken from a process that produces steel rods at Emmanual Kodzi': factory. The length of each rod in the samples was determined. The results were tabulated and sample means and ranges were computed. The results were: \begin{tabular}{cccc} \hline SampleSize,n & MeanFactor,A2 & UpperRange,D4 & LowerRange,D3 \\ \hline 2 & 1.880 & 3.268 & 0 \\ 3 & 1.023 & 2.574 & 0 \\ 4 & 0.729 & 2.282 & 0 \\ 5 & 0.577 & 2.115 & 0 \\ 6 & 0.483 & 2.004 & 0 \\ 7 & 0.419 & 1.924 & 0.076 \\ 8 & 0.373 & 1.864 & 0.136 \\ 9 & 0.337 & 1.816 & 0.184 \\ 10 & 0.308 & 1.777 & 0.223 \\ 12 & 0.266 & 1.716 & 0.284 \\ \hline \end{tabular} For the given data, the x= inches (round your response to four decimal places). Based on the sampling done, the control limits for 3-sigma x chart are: Upper Control Limit (UCL)= inches (round your response to four decimal places). Lower Control Limit (LCL)= inches (round your response to four decimal places). Based on the x-chart, is one or more samples beyond the control limits? For the given data, the R= inches (round your response to four decimal places). The control limits for the 3-sigma R-chart are: Upper Control Limit (UCLR)= inches (round your response to four decimal places). Lower Control Limit (LCLR)= inches (round your response to four decimal places). Based on the R-chart, is one or more samples beyond the control limits
Step by Step Solution
There are 3 Steps involved in it

Get step-by-step solutions from verified subject matter experts