

Question: Refer to Table S6.1-Factors for Computing Control Chart Limits (3 sigma) for this problem Thirty-five samples of size 7 each were taken from a fertilizer-bag-filling
Refer to Table S6.1-Factors for Computing Control Chart Limits (3 sigma) for this problem Thirty-five samples of size 7 each were taken from a fertilizer-bag-filling machine at Panos Kouvelis Lifelong Lawn Ltd. The results were Overall mean = 54 75 lb, Average range R = 1.78 lb a) For the given sample size, the control limits for 3-sigma x chart are Upper Control Limit (UCL) = Lower Control Limit (LCL) = | lb (round your response to three decimal places) lb (round your response to three decimal places) b) The control limits for the 3-sigma R-chart are Upper Control Limit (UCLR) = [ lb (round your response to three decimal places) Lower Control Limit (LCLR) = lb (round your response to three decimal places) Definition Sample Size, n 2 3 4 5 6 7 8 9 10 12 . Mean Factor, A 1.880 1.023 0.729 0577 0 483 0.419 0.373 0 337 0.308 0 266 Upper Range, D4 3.268 2.574 2282 2 115 2.004 1.924 1.864 1.816 1.777 1.716 Lower Range, D3 0 0 0 0 0 0.076 0.136 0.184 0 223 0.284 - X
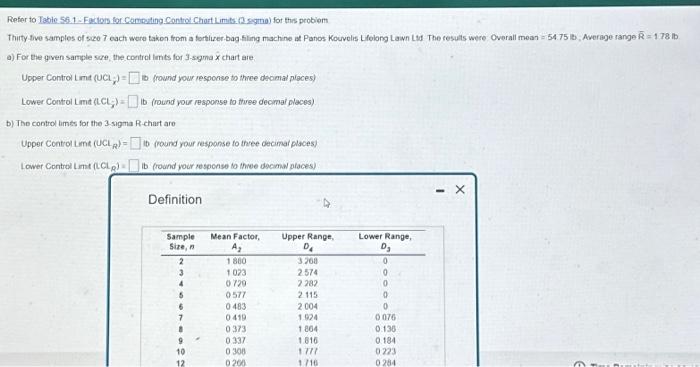
a) For the given sanple scre, the contral imts for 3-sgma x chart are. Upper Control timt (UClx)= ib fround your response to thee decmal piaces) Lower Controi L imat (LCL)= ib (round you response to three decmal places) b) The control limes for the 3-sigma R-chart are Upper Control Lme (UCL LR)= it (round your response to three decimal places) Lower Control Lime (CLR) = ib (round your nesponse to thee docimal places) Definition
Step by Step Solution
There are 3 Steps involved in it
1 Expert Approved Answer
Step: 1 Unlock

To solve this problem we need to calculate the control limits for both the Xbar chart and the Rchart ... View full answer
Question Has Been Solved by an Expert!
Get step-by-step solutions from verified subject matter experts
Step: 2 Unlock
Step: 3 Unlock