

Question: Refer to the above graph. The equilibrium quantity Q1 represents A. the quantity of U.S. dollars supplied by the Federal Reserve in foreign markets B.
Refer to the above graph. The equilibrium quantity Q1 represents
A. the quantity of U.S. dollars supplied by the Federal Reserve in foreign markets
B. the total amount foreigners spent in the United States during a given period
C. the quantity of U.S. dollars supplied and demanded by foreign nationals
D. the quantity of U.S. dollars demanded by foreigners who purchase U.S. goods and services and U.S. assets
Answer A is NOT CORRECT
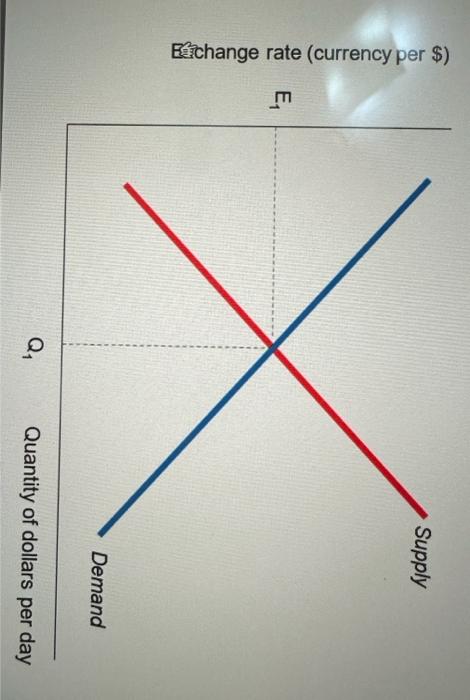
Echange rate (currency per $) Supply Demand Q Quantity of dollars per day
Step by Step Solution
There are 3 Steps involved in it
1 Expert Approved Answer
Step: 1 Unlock

Question Has Been Solved by an Expert!
Get step-by-step solutions from verified subject matter experts
Step: 2 Unlock
Step: 3 Unlock